Here’s how South Africa’s social grant system has changed since 1994
SASSA pays 26-million grants every month
The South African Social Security Agency (SASSA) is paying grants to over 26-million people.
- The South African Social Security Agency (SASSA) spent R232-billion on social grants in 2022 - about 11% of the national budget.
- Social grant spending, when adjusted for inflation, has quadrupled since 1994.
- The vast majority of beneficiaries receive either the Child Support Grant or Old Age Grant.
- Grant amounts are about the same as they were in 1994 when inflation is taken into account.
In 1994, when South Africa became a democracy, the country paid grants for about 2.5-million people - mostly old age grants, disability grants and state maintenance grants (the predecessor of the child support grant).
Today, the South African Social Security Agency (SASSA) pays 26-million social grants a month.
How grant expenditure has increased since 1994
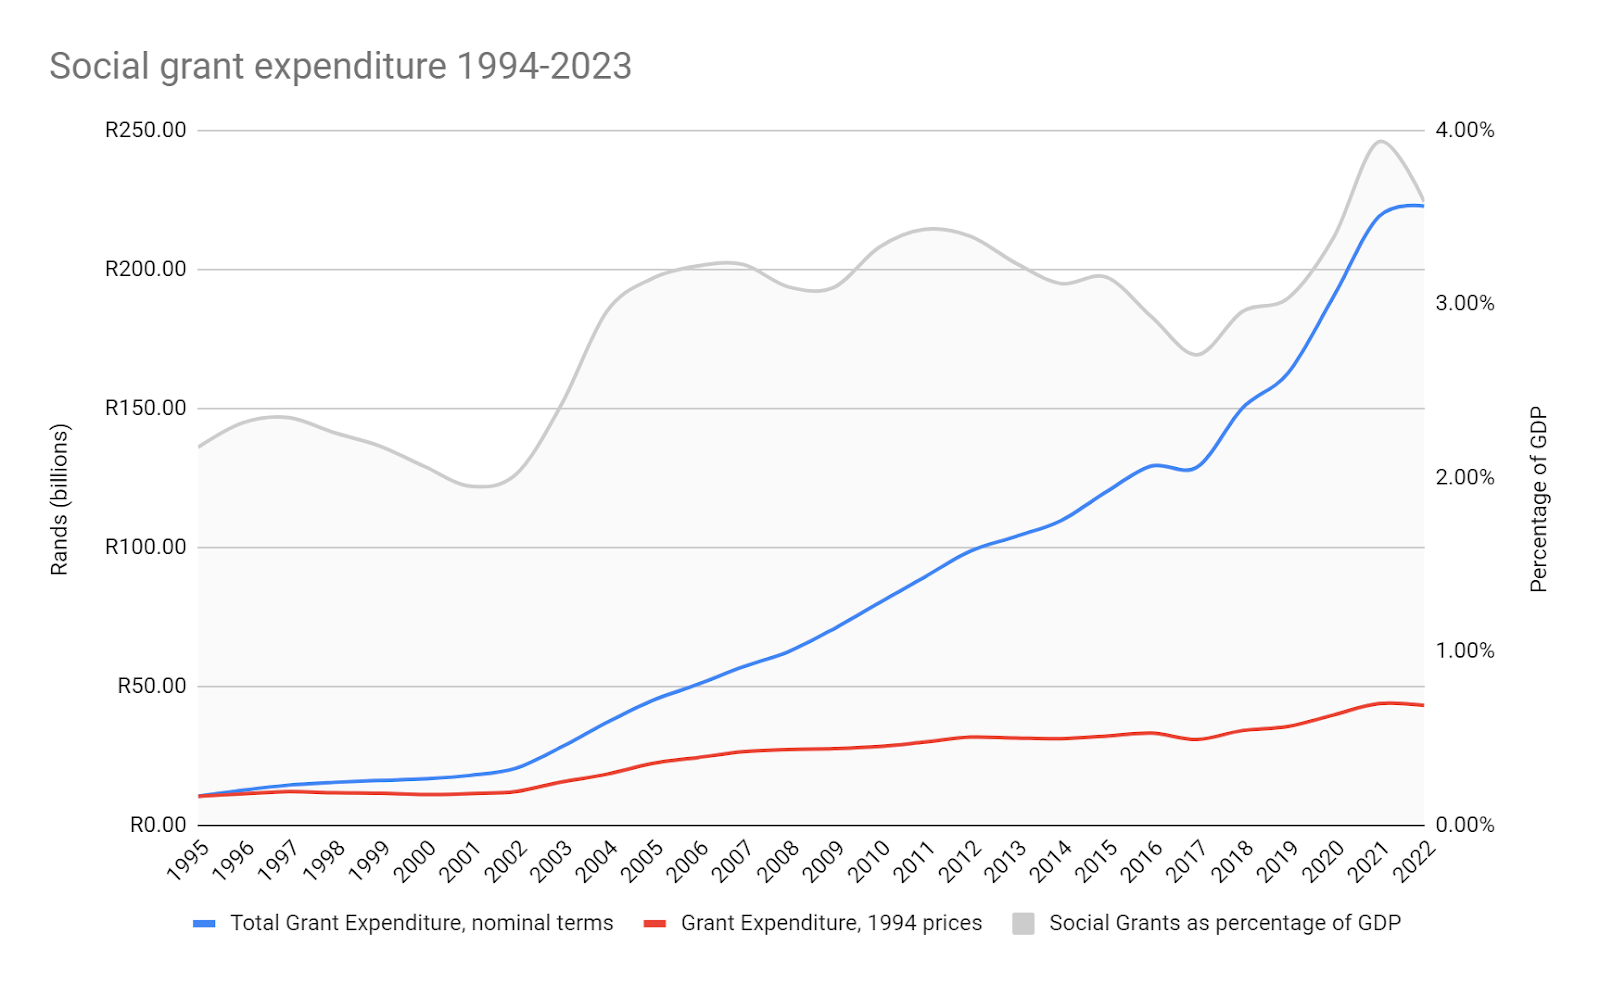
This chart shows state expenditure on social grants since 1994. Data sourced from National Treasury, StatsSA, and UCT’s Centre for Social Science Research.
Before and in the early years of apartheid, social grants were focused primarily on white people. For example, Old Age Pensions were introduced in 1928, at first only for ‘white’ and ‘coloured’ people. These were extended to ‘Indian’ and ‘black’ people in 1944, although people of colour received less money than white people.
In the later years of apartheid, the value of the old age pension for white people decreased while that for the black majority increased. By 1994, state old age pensions were the same for everyone.
There were also disability and state maintenance grants for children and foster parents.
The number of black beneficiaries also increased as apartheid came to an end and the “homelands” for black people were dissolved.
Since 1994, government spending on social grants has increased from R10.5-billion in 1994 to R232.7-billion - about 11% of the R21-trillion national budget - in 2022. When adjusted for inflation, social grant expenditure has quadrupled since 1994.
As a percentage of South Africa’s Gross Domestic Product (GDP), grant expenditure has increased over the years. Grant expenditure has had to increase with a growing population and to keep pace with inflation, while South Africa’s economy has grown very slowly.
How the number of grant recipients has increased since 1994

This chart shows how grant recipients have increased since 1994. Data was provided by UCT’s Centre for Social Science Research.
About 42% of South Africa’s population receives a social grant. This is up from 6.5% in 1994. These are the main grants paid by the government every month (recipient numbers are approximate):
|
Grant Type |
Description |
Recipients |
Value |
|
Child Support Grant |
Introduced in 1998, the Child Support Grant replaced the State Maintenance Grant |
353,000 in 1998 13.2-million in 2022 |
R510 in 2023 |
|
Foster Child Grant |
For parents fostering children |
42,000 in 1996 274,000 in 2022 |
R1,130 in 2023 |
|
Old Age Grant |
For unemployed people aged 60+, subject to a means test. Before 2008, the eligibility age for men was 65 and for women 60 |
1.63-million in 2022 3.9-million in 2022 |
R2,090 in 2023 |
|
Grant in Aid |
For Older Persons in need of full-time care. Introduced in 1996 |
10,000 in 1996 328,000 in 2022 |
R510 in 2023 |
|
Disability Grant |
For temporarily or permanently disabled people |
600,000 in 1994 1,035,000 in 2022 |
R2,090 in 2023 |
|
Child Care Dependency |
For disabled children who need full-time care. Introduced in 1996 |
10,000 in 1997 157,000 in 2022 |
R2,090 in 2023 |
|
Covid-19 Social Relief of Distress |
Introduced in 2020, for unemployed people with income less than R624 a month |
7.3-million in 2022 Number of beneficiaries fluctuates monthly based on means test |
R350 in 2023 |
How grant values have increased since 1994


These two charts compare the values of social grants paid since 1994 to the three poverty lines. The top chart is in nominal terms and the bottom one is in real terms (1994 prices). StatsSA only started calculating and publishing the three poverty lines in 2007. Data sourced from SASSA and StatsSA.
According to the World Bank, poverty reduction in South Africa has stagnated since 2011 and the number of poor people has increased in recent years.
The World Bank’s most recent survey in 2014 found that 55% of the population was living below the national upper-bound poverty line of R992 a month and 25% was living in food poverty. The World Bank now estimates that 63% of the population is living below the upper-middle-income country poverty line (R40 per day), an increase of 1.8-million people since before the Covid pandemic.
Social grants have contributed to a reduction in poverty rates since apartheid. According to the International Monetary Fund, South Africa’s social grants are able to cover about 60% of household expenditure for the poorest 20% of the population.
Since 1994, the Old Age Grant has increased from R390 to R1,985 in 2022. But when adjusted for inflation, it has pretty much stayed the same. The grant has steadily remained above the upper-bound poverty line (R1,417 in 2022). That said, in many cases, the grant is used to maintain larger households, bringing the average per person income of the household below the upper-bound poverty line.
The Foster Care Grant is paid per foster child and is meant to cover the costs of raising that child. The grant has not kept pace with inflation and while it was close to the upper-bound poverty line in 1994, it is now only slightly above the lower-bound food poverty line (R663 in 2022).
The Child Support Grant was close to the food poverty line between 2006 and 2007. While the Child Support Grant has contributed to reducing food poverty in children since it was introduced, a 2023 review of the grant by the Department of Social Development suggests that unless it is increased to meet at least the food poverty line, the grant will not be sufficient to keep reducing child poverty. Since 2012, the grant has been available to children up until the age of 18. Before this, the grant ended at the age of 13.
Research by the University of Johannesburg’s Centre for Social Development in Africa found that grant money is mainly spent on food, but also “to make productive investments in livelihood activities”. The Social Relief of Distress grant, for example, increases the probability that a recipient will keep looking for a job.
The research found that in 2021, a third of all grant beneficiaries and 14% of Child Support Grant beneficiaries did informal work. 8.6% of all grant beneficiaries were self-employed.
It should be noted that the data used in the graphs above do not include other forms of social assistance, such as workfare programmes, feeding schemes, or NSFAS grants and loans.
Thanks to Professor Jeremy Seekings for assistance.
Support independent journalism
Donate using Payfast
![]()
Don't miss out on the latest news
We respect your privacy, and promise we won't spam you.
Next: Protesters storm Durban City Hall
Previous: No clarity on when Makhanda will have a post office again
© 2023 GroundUp. This article is licensed under a Creative Commons Attribution-NoDerivatives 4.0 International License.
You may republish this article, so long as you credit the authors and GroundUp, and do not change the text. Please include a link back to the original article.
We put an invisible pixel in the article so that we can count traffic to republishers. All analytics tools are solely on our servers. We do not give our logs to any third party. Logs are deleted after two weeks. We do not use any IP address identifying information except to count regional traffic. We are solely interested in counting hits, not tracking users. If you republish, please do not delete the invisible pixel.