South Africa: key statistics ahead of the 2024 elections
Here is how we’re doing on unemployment, murder, housing, life-expectancy and social grants
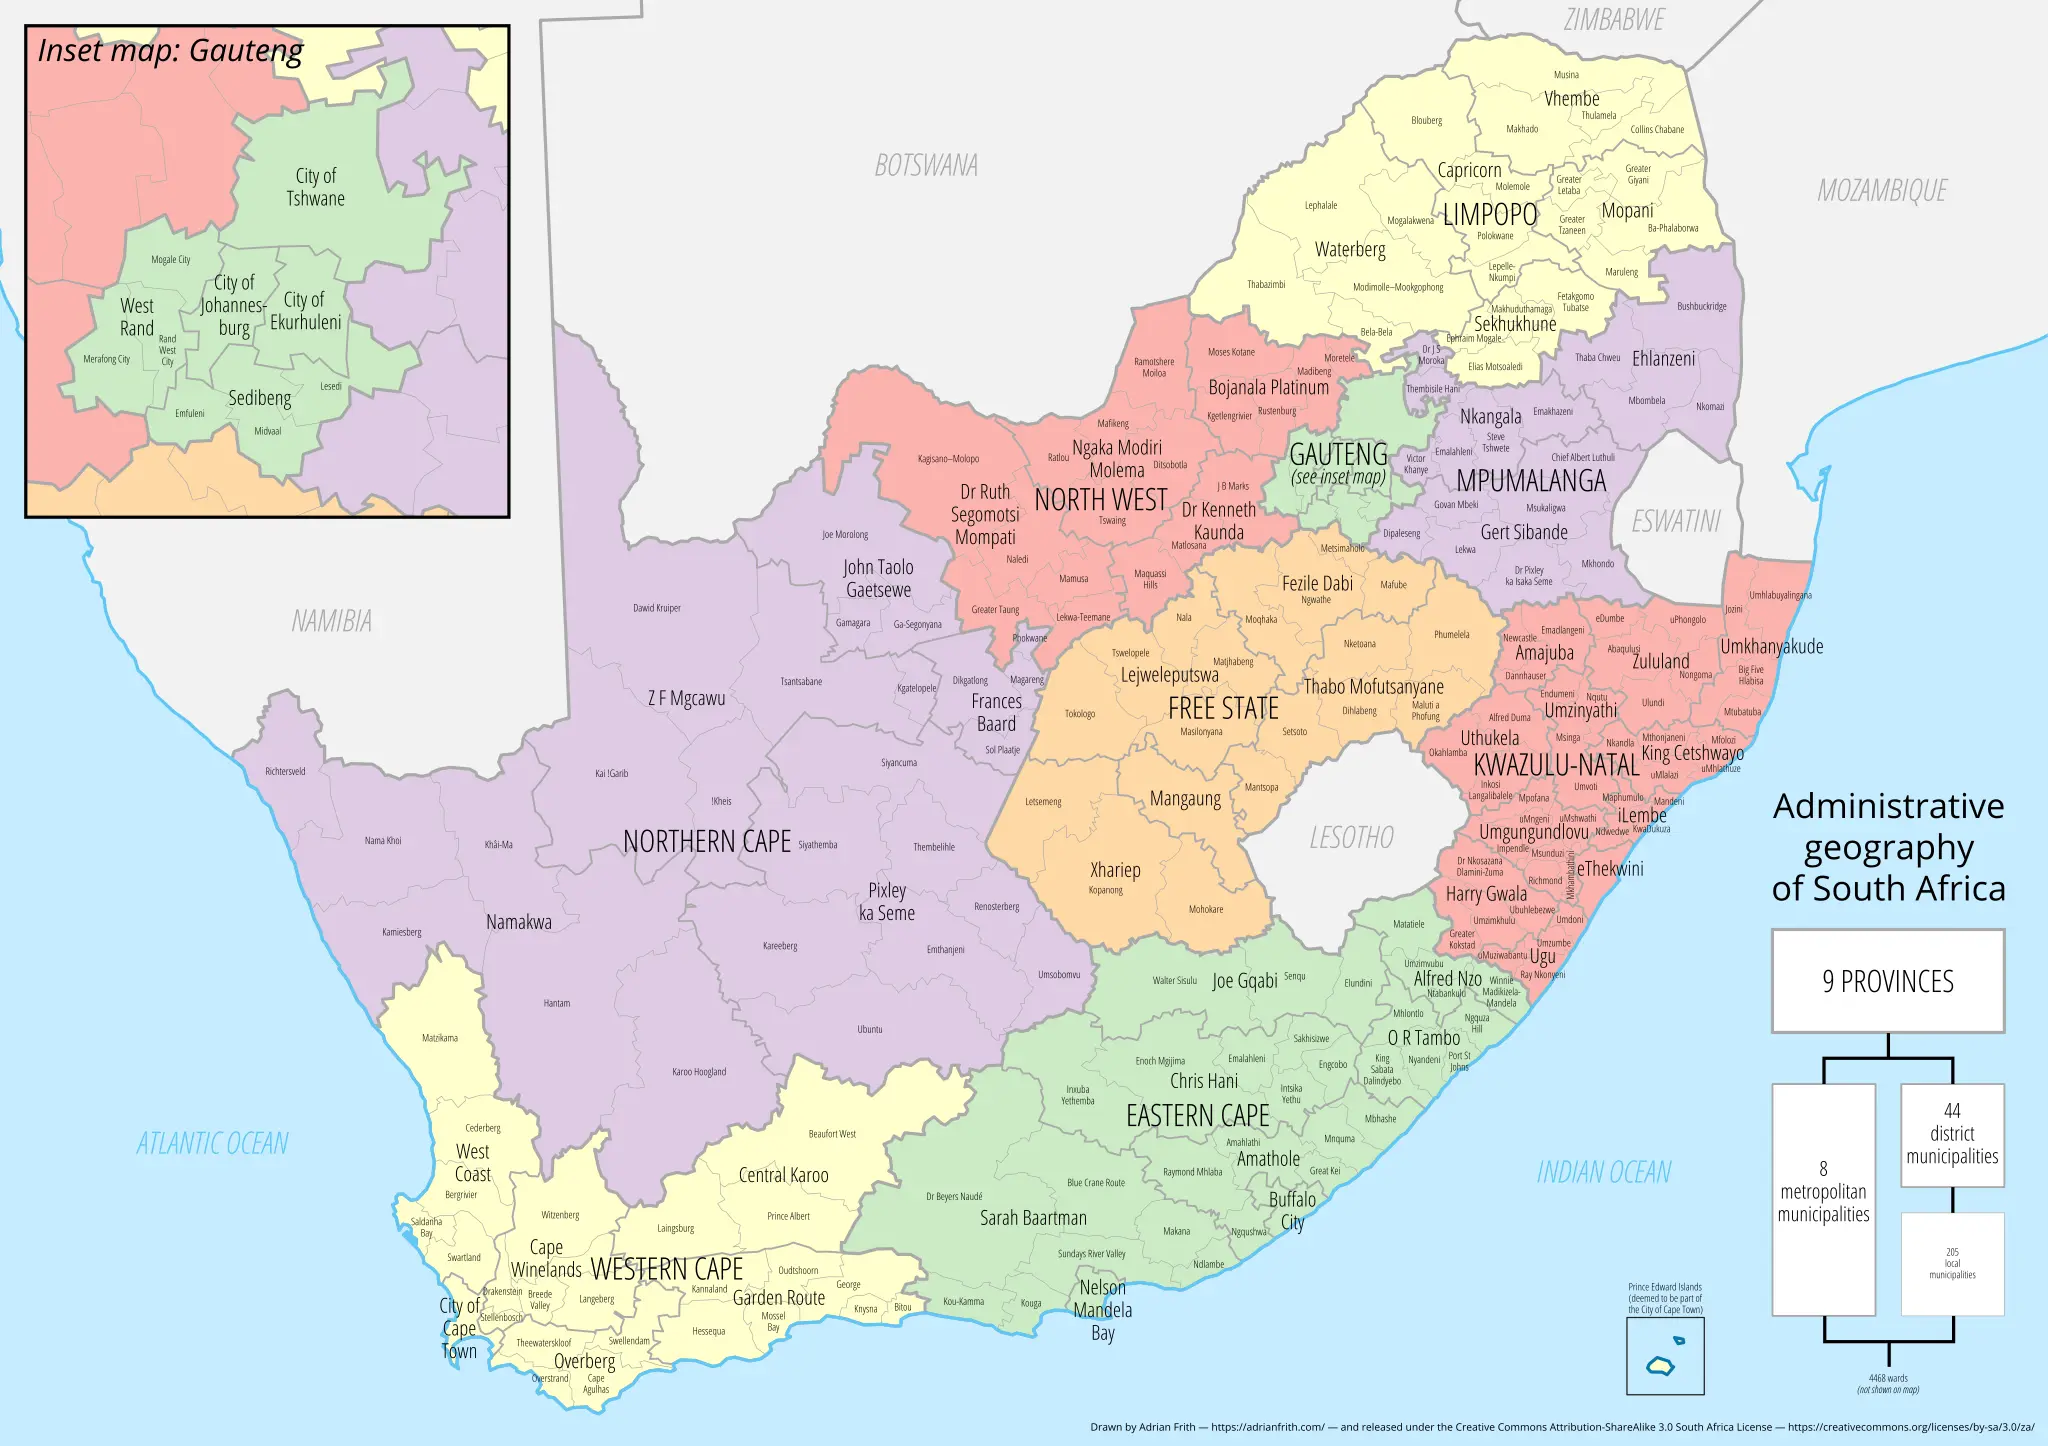
Map of the administrative geography (provinces and municipalities) of South Africa, as of 2021. Drawn by Adrian Frith based on MDB Local Municipal Boundary 2018 dataset. (Via Wikipedia, CC BY-SA 4.0 Deed)
Ahead of the 2024 election, we examined how South Africa has done on several important measures over the past few decades. We looked at the following topics
- murder;
- unemployment and how it has changed since 2000;
- social grants and how coverage has changed since democracy;
- state provision of housing; and
- HIV and life-expectancy.
Murder and crime
Crime consistently ranks as one of the two major concerns of South Africans, along with unemployment. But other than murder, crime rates are hard to measure because many crimes go unreported. Murder is both the most serious and best measured crime. It’s a proxy for how we’re doing on crime generally. Unfortunately the country is regressing.
From 1995 until about a decade ago South Africa was making headway. The murder rate was dropping. But for the past decade it has steadily got worse.
|
Year |
Murders |
Per 100k |
|
2012/13 |
16,213 |
31 |
|
2013/14 |
17,023 |
32 |
|
2014/15 |
17,805 |
33 |
|
2015/16 |
18,673 |
34 |
|
2016/17 |
19,016 |
34 |
|
2017/18 |
20,336 |
36 |
|
2018/19 |
21,022 |
37 |
|
2019/20 |
21,325 |
37 |
|
2020/21 |
19,972 |
34 |
|
2021/22 |
25,181 |
43 |
|
2022/23 |
27,272 |
46 |
Number of murders in South Africa, April 2012 to March 2023, and the corresponding murder rate (murders per 100,000 people). Sources: SAPS and Thembisa
Read How bad is South Africa’s murder rate?
Unemployment
Our chronic, most pressing problem that we have failed to fix is unemployment.
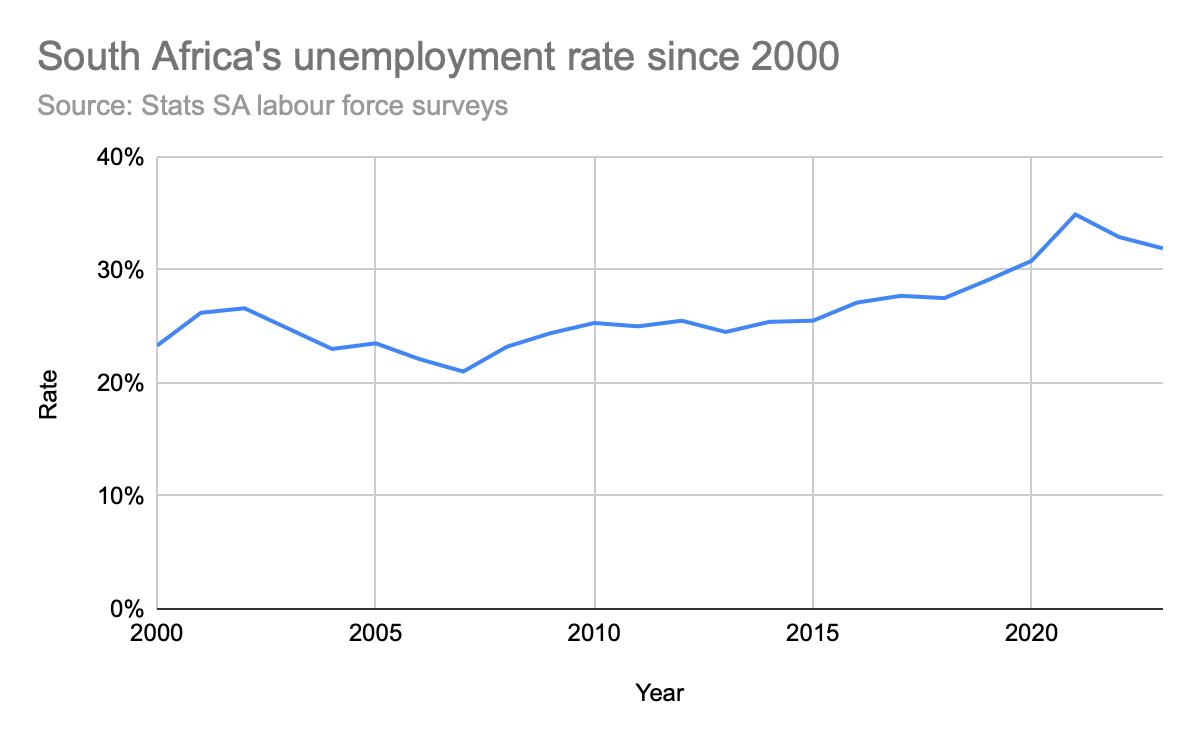
The unemployment rate has not dropped below 20% since 2000. The graph was constructed using the quarterly labour force surveys published by Stats SA.
Read How unemployment has changed since 2000
Social grants
In the face of massive unemployment, the social grant system helps millions of people in South African to survive. Without it the country would be plunged into chaos. The following graph shows how the number of grant recipients has increased since democracy.

This chart shows how grant recipients have increased since 1994. Data was provided by UCT’s Centre for Social Science Research.
Read Here’s how South Africa’s social grant system has changed since 1994
Housing
The Reconstruction and Development Programme of the ANC in 1994 was its flagship programme and promised to provide everyone with houses. While much progress was made, there is still a long way to go. We found that the quality of data was unexpectedly poor, especially the 2022 census that was published this year.
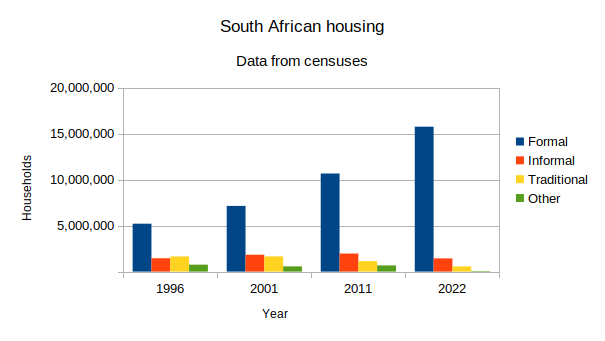
Sources: Census 1996, 2001, 2011, 2022 from Stats SA
Read Housing in South Africa: How have we done since 1994?
HIV and life-expectancy
We examined how antiretroviral treatment has reversed the country’s decline in life-expectancy. The following graph of South Africa’s change in life-expectancy since the late 1980s and projected to 2030 is quite extraordinary. One would be hard-pressed to find a country in the world with life-expectancy as volatile as this. The first dip was due to the HIV epidemic. The second, much shorter one, was due to Covid. The good news is that life-expectancy appears to be on a sustained upward trajectory.

South Africa’s life-expectancy is now about 64. Barring any unforeseen catastrophes it will continue to rise to well above 65 by 2030, the highest it has ever been but still far below the world average. The data for the graph was sourced from the Thembisa HIV model.
Read South Africans are living longer, mostly thanks to HIV treatment
Support independent journalism
Donate using Payfast
![]()
Don't miss out on the latest news
We respect your privacy, and promise we won't spam you.
Next: 2023 in Photos: From the high of winning the World Cup to a devastating inner city fire
Previous: Cape Town’s railway occupiers are being moved but there are snags with water and sanitation supply
Letters
Dear Editor
The official unemployment rate does not show the true, extraordinary nature of unemployment in South Africa, which is why discouraged jobseekers' data is included in Stats SA's Quarterly Labour Force Surveys and other analyses. Your graph should too. Including discouraged jobseekers - those who have given up finding work - the expanded rate is 41.2% for Q3 2023.
Even then SA's official rate is the highest in the world followed, by Djibouti and West Bank/Gaza. South Africans should be asking how we got here.
© 2023 GroundUp. This article is licensed under a Creative Commons Attribution-NoDerivatives 4.0 International License.
You may republish this article, so long as you credit the authors and GroundUp, and do not change the text. Please include a link back to the original article.
We put an invisible pixel in the article so that we can count traffic to republishers. All analytics tools are solely on our servers. We do not give our logs to any third party. Logs are deleted after two weeks. We do not use any IP address identifying information except to count regional traffic. We are solely interested in counting hits, not tracking users. If you republish, please do not delete the invisible pixel.