Gauteng sewage has shown high rates of Covid-19 for three weeks
Other hotspots are Gqeberha and Cape Town
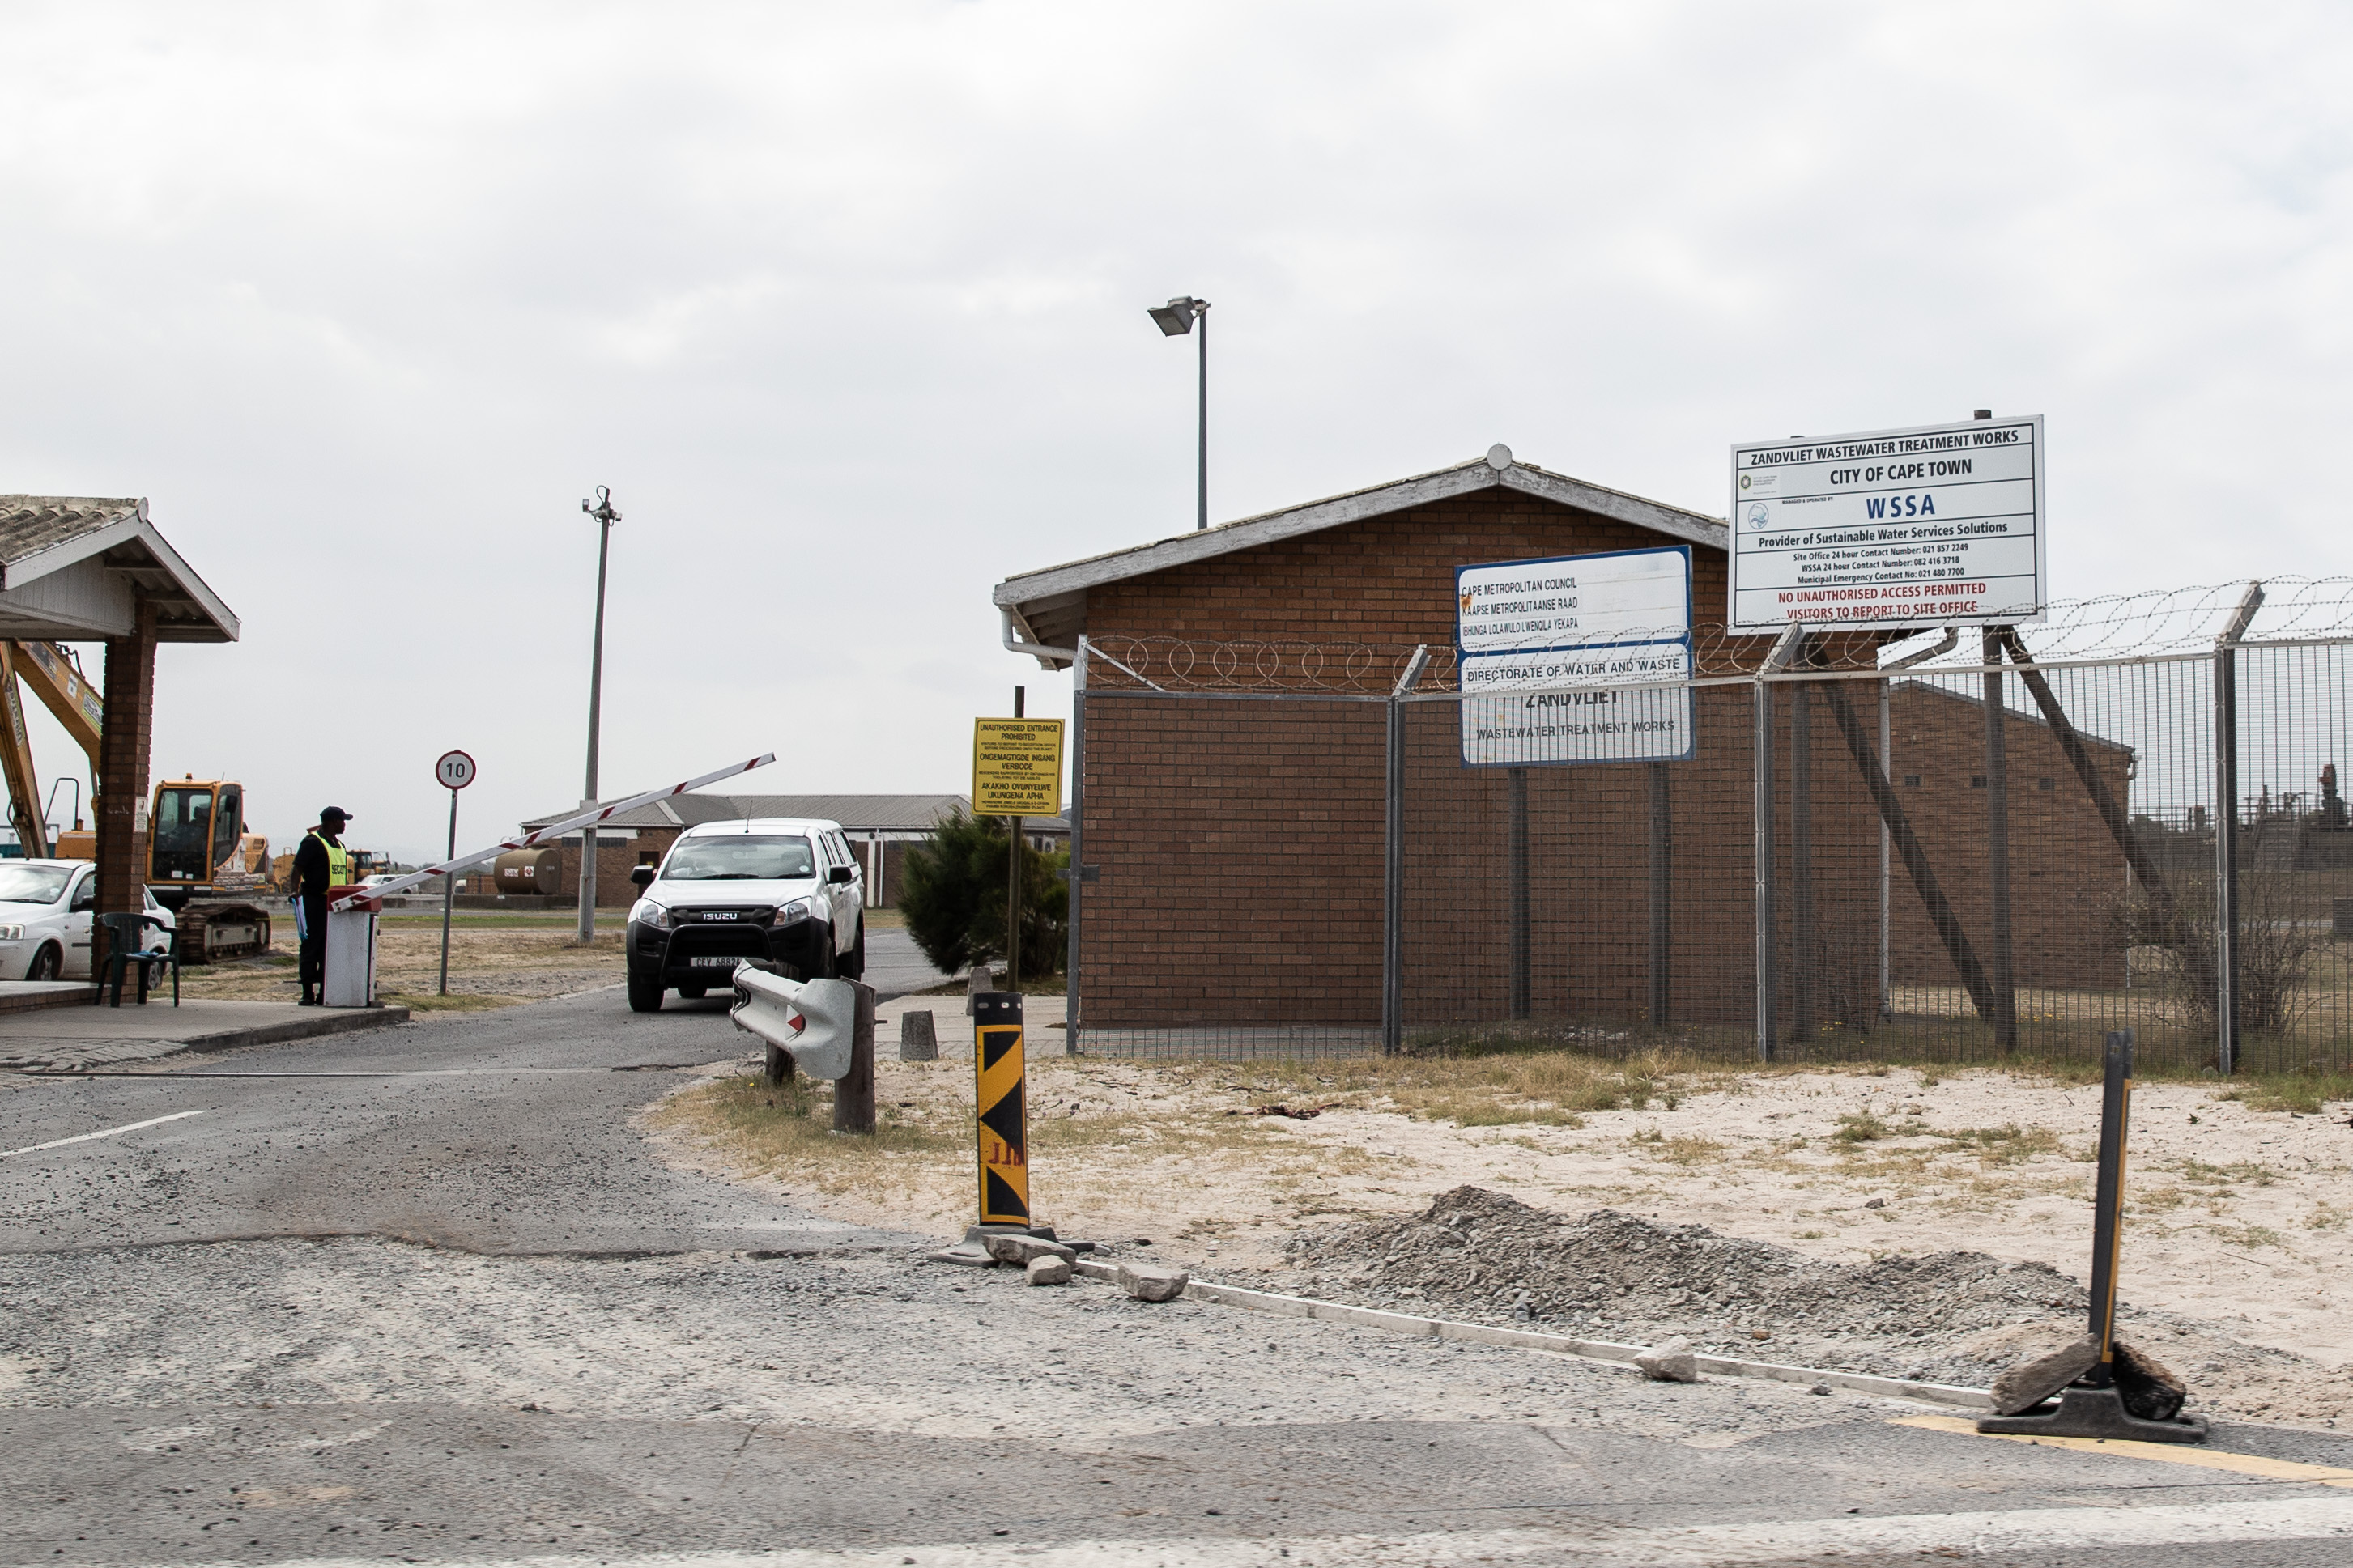
The Zandvliet waste treatment works in Cape Town is one of the facilities being monitored for prevalence of SARC-CoV-2 viral loads. Archive photo: Ashraf Hendricks
The Medical Research Council (MRC) SARS-CoV-2 wastewater surveillance project has detected a three-week-long surge in Gauteng, as well as hotspots in Gqeberha and Cape Town.
The project monitors the prevalence of SARS-CoV-2 viral loads at 70 wastewater treatment plants across four provinces: 20 plants in the Eastern Cape, nine in Gauteng, eight in Limpopo, and 32 in the Western Cape. MRC researchers collect samples from these plants and submit them for PCR tests.
The MRC then analyses the data from these tests, and categorises the results, displayed as RNA copies per millilitre, in a five-tier system. Category one is the lowest SARS-CoV-2 viral load (0-500 RNA copies/ml), and Category five, the highest SARS-CoV-2 viral load (more than 7,500 RNA copies/ml).
The MRC warns that “it is not possible to accurately predict the number of infected individuals within a particular wastewater catchment area or community, based on wastewater surveillance.” However, the data can be used by public health officials to guide their response to the epidemic.
With the third wave of infections still rising, here is what this week’s results tell us.
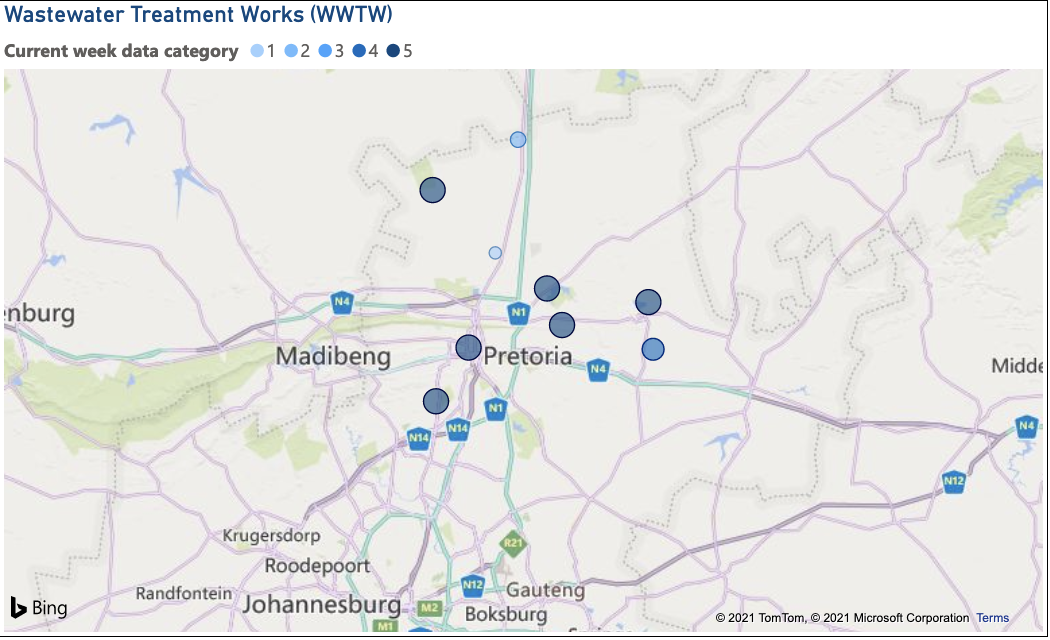
Map of the wastewater treatment works in Gauteng
Gauteng
In Gauteng, the MRC’s programme monitors nine treatment plants in and around Tshwane. Johannesburg itself is surveilled by the National Institute of Communicable Diseases (NICD), who do not provide public data at present. Calls to the NICD were not answered.
Only three weeks’ worth of data is available for the MRC’s Gauteng plants. This was due to a quality control issue, which meant that samples from the sites in Gauteng were unreliable. As a result, the surveillance project did not capture useable data for the rise of the third wave.
But the current data presents a stark picture. Six of the nine wastewater treatment sites reported the very highest degree of SARS-CoV-2 prevalence for the last three weeks in a row.
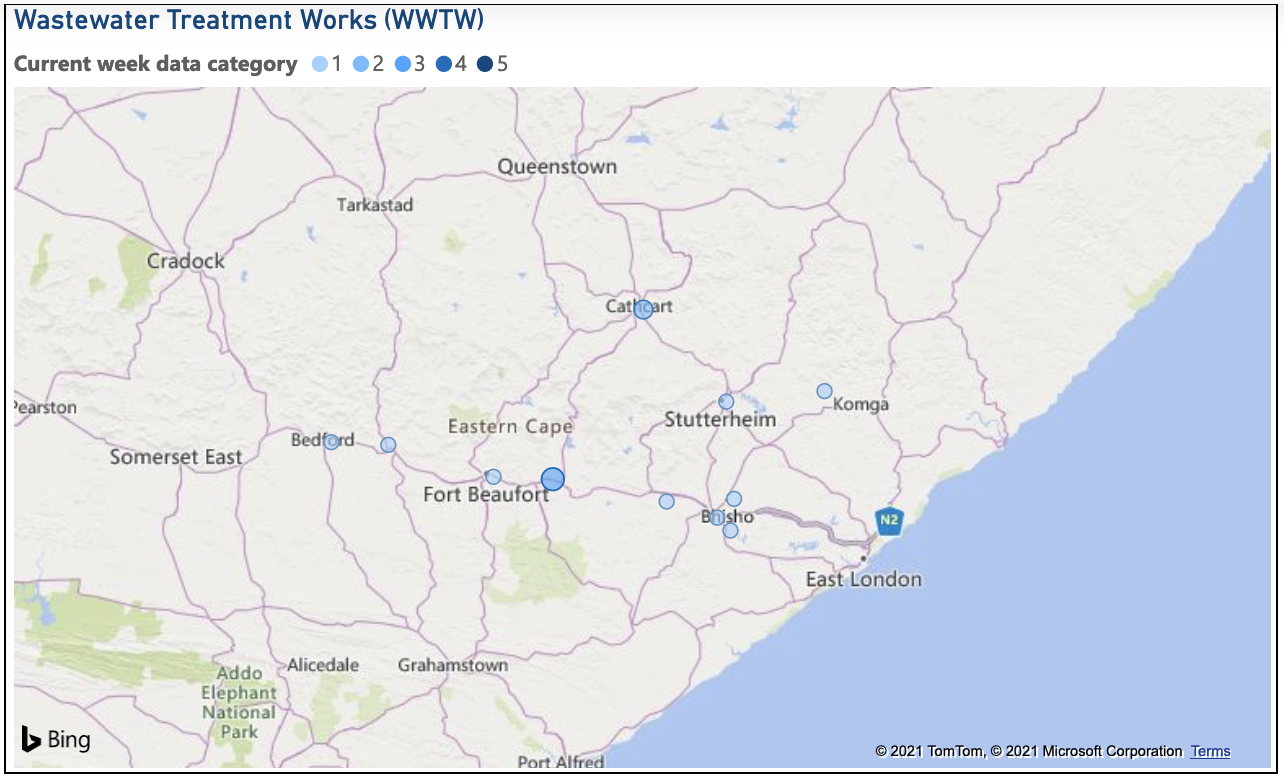
Map of the wastewater treatment works in Eastern Cape
Eastern Cape
The Eastern Cape was the province worst hit by the previous wave of infections. The surveilled plants in this province are divided between a Gqeberha cluster, and a set of 11 more rural plants north west of East London. Data here begins from March.
Across the eight Gqeberha plants, surveillance data suggests infections are on the rise. Two plants – Aloes and Driftsands – have risen to the highest prevalence category this week, and two more – Fishwater flats and Despatch – are placed in the second-highest category.
The highest prevalence in the more rural cluster of plants is in Alice, home to the University of Fort Hare. Here, prevalence is on an apparent decline, after two weeks of category five prevalence in early June. All other rural plants are at the lowest category except Cathcart, which has risen to category two this week.

Map of the wastewater treatment works in Limpopo
Limpopo
Prevalence in Limpopo is low in all but one of the eight wastewater sites.
Wastewater samples are at category five at Ga-Kapane, in the Mopani District Municipality, just under 100km east of Polokwane. Six out of the ten weeks surveyed have been in this highest category.
The next-nearest plant in Tzaneen, 22km to the south, is in the lowest category of SARS-CoV-2 detection.

Map of the wastewater treatment works in Western Cape
Western Cape
The Western Cape has the most treatment plants under surveillance, and has eleven plants showing the very lowest levels of SARS-CoV-2 prevalence. There are just two plants in the Western Cape at the highest category of prevalence, De Doorns and Gordons Bay, and two more at Category four, Camps Bay and Worcester.
However, only three of the plants surveyed are trending down and ten sites are reporting higher rates of prevalence than the previous week.
What the results tell us
The MRC’s dashboard is the only public-facing data of wastewater surveillance available in Africa, according to Covid-19Poops, a dashboard that tracks similar wastewater surveillance efforts across the world.
Professor Angela Mathee works on the wastewater surveillance project in her capacity as a director at both the MRC and World Health Organisation. She told GroundUp that while the wastewater surveillance has been helpful to authorities guiding the management of Covid-19, this programme can’t be implemented where there are no formal wastewater systems. And where such systems are dysfunctional, they can’t sample, as the results will not be representative of the community.
Professor Mathee told GroundUp that the areas reporting higher rates of prevalence do not necessarily correlate to the population living in that area. If there are many people living in informal settlements, their wastewater may not be processed at the nearest plant to them. If residents are supplied with portable toilets, these will be serviced by a contractor.
“It’s a form of exclusion and marginalisation. We can’t include those people in the protective umbrella of Covid surveillance,” said Professor Mathee.
However, Professor Mathee said that the MRC is going to see if there are other ways to include people who don’t live in areas connected to formal wastewater treatment, by monitoring rivers and soil.
Given the Covid-19 surveillance results, the MRC may look at other applications for the wastewater programme to include surveillance of other diseases. Elsewhere in the world, wastewater surveillance has given public health officials data on measles outbreaks, pharmaceutical use, and pollutants.
Support independent journalism
Donate using Payfast
![]()
Don't miss out on the latest news
We respect your privacy, and promise we won't spam you.
Next: Gauteng families huddle around fire at night without food or sufficient shelter
Previous: Limpopo villagers have to buy their drinking water
© 2021 GroundUp. This article is licensed under a Creative Commons Attribution-NoDerivatives 4.0 International License.
You may republish this article, so long as you credit the authors and GroundUp, and do not change the text. Please include a link back to the original article.
We put an invisible pixel in the article so that we can count traffic to republishers. All analytics tools are solely on our servers. We do not give our logs to any third party. Logs are deleted after two weeks. We do not use any IP address identifying information except to count regional traffic. We are solely interested in counting hits, not tracking users. If you republish, please do not delete the invisible pixel.