These graphs show PRASA’s disastrous state
No trains, no hope? We show just how bad things are at PRASA.
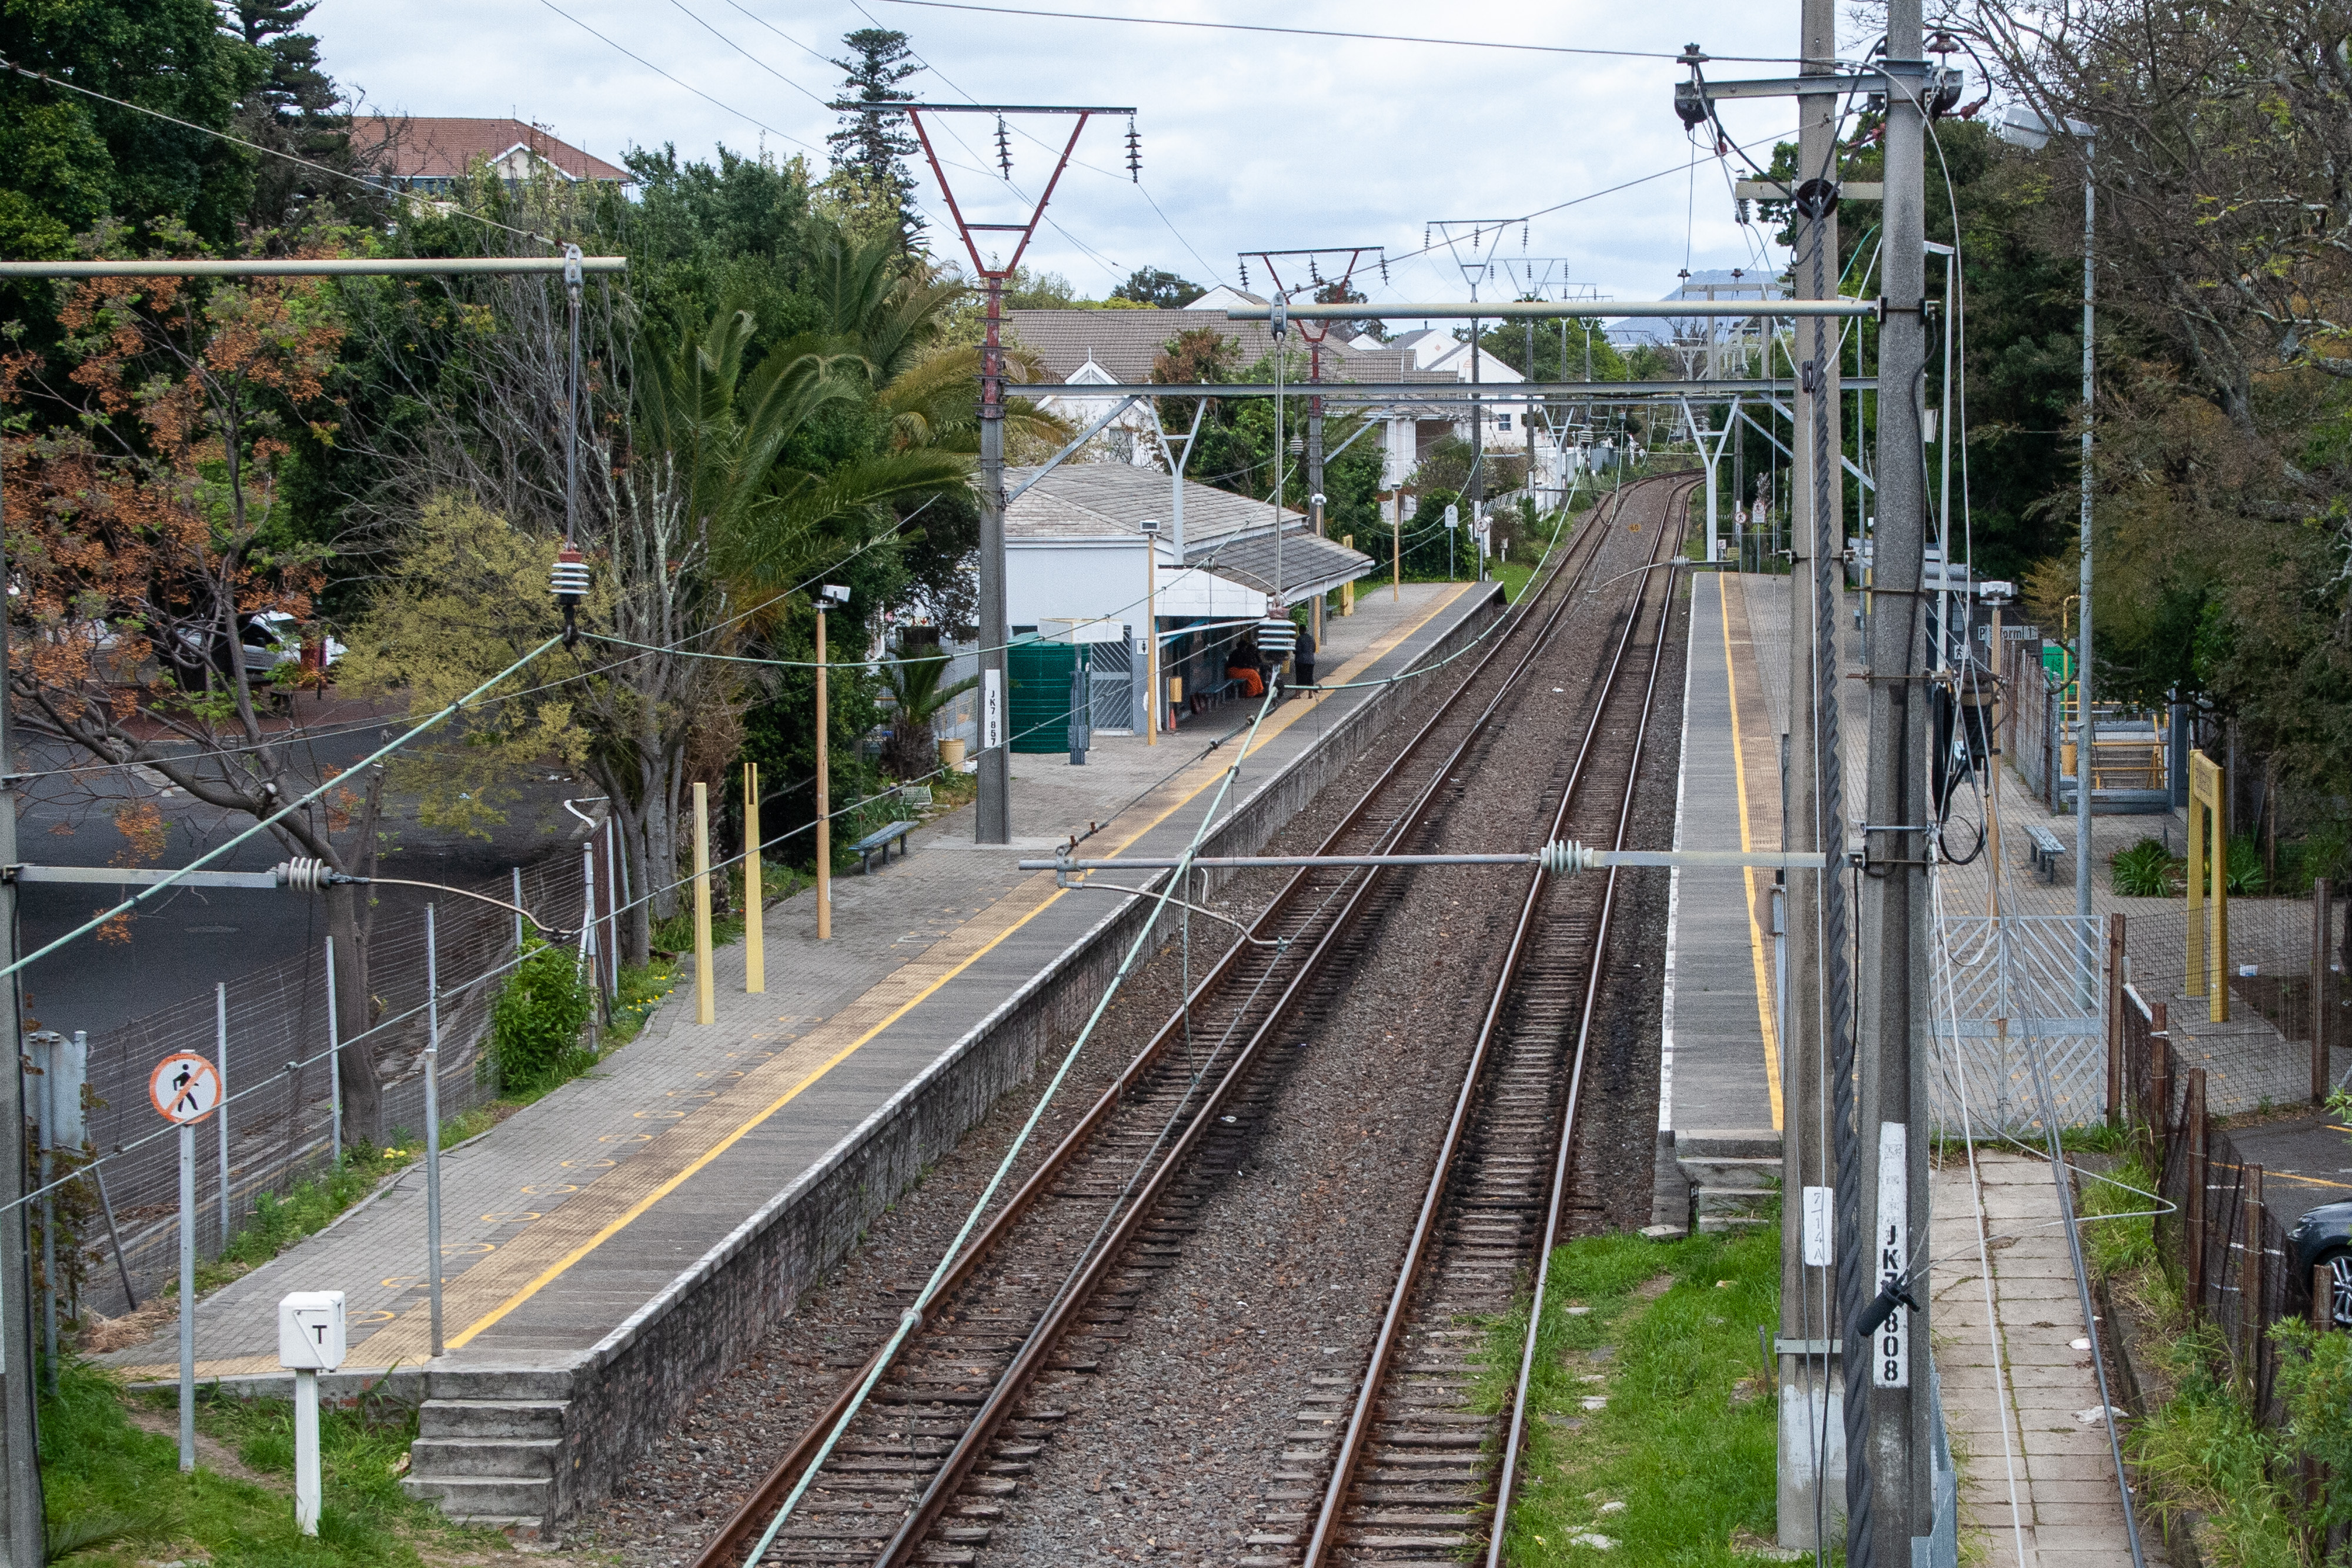
One of the main consequences of the grand scale corruption over more than a decade is that there are not enough trains. Photo: Ashraf Hendricks
1. Revenue from train fares has plummeted while the state subsidy has skyrocketed
Nothing quite conveys the disastrous state of PRASA like graph 1 below. What it shows is this: In 2008, PRASA collected R1.2-billion in fares (blue line). Thirteen years later, in 2021, it collected R178-million.
Yet over that period PRASA’s government funding (green line) mushroomed. Its operating subsidy ballooned from R2.6-billion to R8.8-billion. Its capital subsidy grew from R282-million to R2.9-billion (with a high of R4.3-billion in 2019/2020).
In the graph, total revenue looks healthy. But PRASA includes the money that it receives from the government as a subsidy in its revenue calculations - first, its operational subsidy and then, in the 2020/21 annual report, also its capital subsidy.
The steady climb in the operational subsidy - the green line - is mirrored by the depressing trajectory of the fare revenue.

Graph 1: PRASA’s sources of revenue. Source: PRASA annual reports
2. Interest on cash reserves exceeds income from fares
Commuter rail is by nature a subsidised mode of transport. Taxes are used to reduce the cost of a passenger’s journey. But in the next graph we see how fares have formed a smaller and smaller share of PRASA’s total revenue.
By the end of the 2019/2020 financial year, interest earned on its cash reserves contributed more to PRASA’s revenue than income from fares or from its rental properties.
We could interpret this as showing a decision by the government to reduce fares and wholly fund train transport from taxes - like Spain recently decided to do. But this is not the case. What we see is what happens when passengers can’t take any trains.
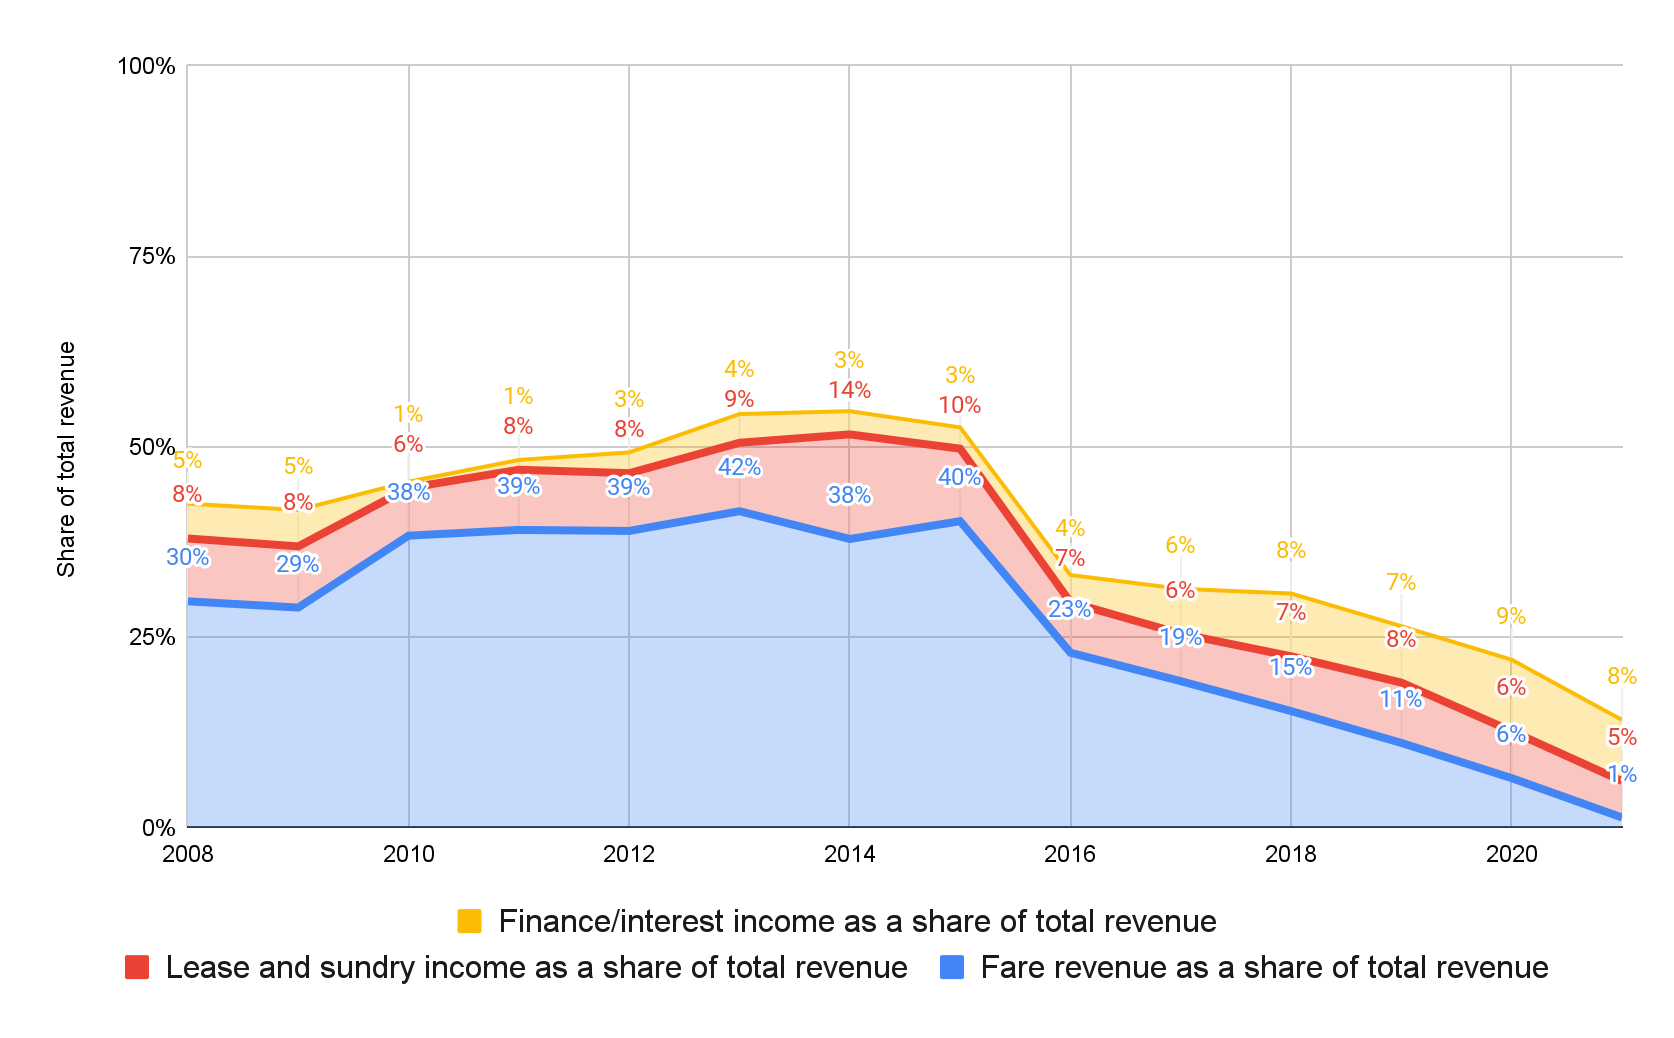
Graph 2: Fares as a share of total revenue. Source: PRASA annual reports
3. The number of passenger trips has plummeted
The graph below shows the collapse in passenger trips.
The red dashed line shows the total passenger trips during 1998, which is GroundUp’s calculation using data from PRASA’s 2008/09 annual report. The blue line shows annual passenger trips for each year from 2008.
The decline in passengers is largely the result of there being not enough trains. According to Statistics South Africa’s National Household Travel Survey, 2020, the single biggest reason nationally why people are not using trains is that trains are simply not available to them.
Between 1998/99 and 2008/09, there were an average of 43-million rail passenger trips per month. PRASA recorded its peak ridership in 2008/09, reporting an average of 54-million passenger trips per month, according to its annual report.
Covid all-but collapsed commuter rail. StatsSA’s latest Land Transport Survey, released on 19 September, shows that rail is not recovering, despite all promises. The number of passenger trips recorded in June and July 2022 is lower than the same period last year.
Between January 2021 and July 2022, there were an average of 1.7-million rail passenger trips per month. This is 4% of the monthly average over the ten years between 1999 and 2008, and just 3% of PRASA’s peak.
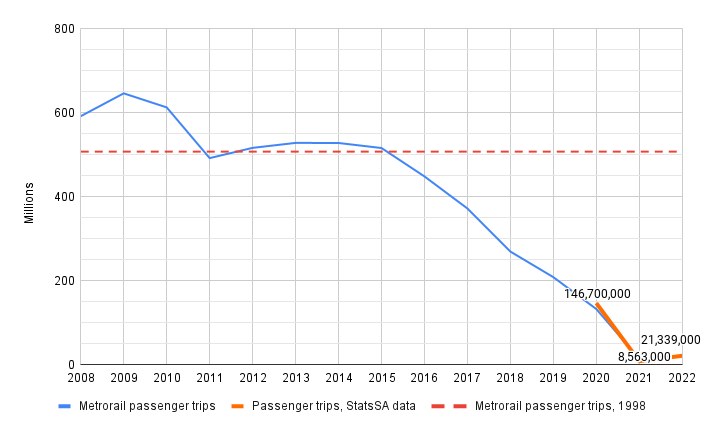
Graph 3: Change in passenger trips on Metrorail trains. Various sources
4. PRASA is unable to spend its capital
In the graph below, using nominal (not taking into account inflation) amounts from PRASA’s annual reports, we see PRASA’s investment spending in red, compared to its available cash reserves.
Earlier this month, the Department of Transport came before Parliament’s Standing Committee on Appropriations to explain the Passenger Rail Agency of South Africa’s (PRASA’s) “perennial underspending on capital infrastructure”.
According to the media statement released on behalf of Sfiso Buthelezi, the chairperson of the committee, “the unspent funds should be given to other departments that are actively spending their budgets on service delivery”. There’s an irony in this; Buthelezi himself was the chairperson of PRASA between 2008 and 2014.
In his statement, Buthelezi expressed the committee’s “concerns with PRASA’s poor record on project and contract management”. Again, ironic, since the dodgy contracts from Buthelezi’s time as chair are a leading cause of PRASA’s inability to spend its capital budget.

Graph 4. PRASA fails to spend its cash. Source: PRASA annual reports
5. Irregular expenditure has gone through the roof
The graph below shows the balance of irregular expenditure at PRASA. If irregular expenditure is not pardoned by the National Treasury, recovered or written off, then it is rolled over to the next financial year.
In 2020/21 PRASA reported R29-billion in irregular expenditure. In the annual report for 2013/2014, Buthelezi’s last full year as chairperson, just R10.9-million in irregular expenditure was reported. But this figure was deceptive.
Most of this irregular expenditure stems from a reevaluation performed under the instruction of the board that replaced Buthelezi’s board, led by Popo Molefe. As recorded in the 2015/16 annual report, R9.8-billion was discovered from the years when Buthelezi was chairperson. This figure was to increase as more irregularities were uncovered.
Earlier this year, Chief Justice Raymond Zondo recommended that the Office of the National Director of Public Prosecutions consider instituting a prosecution against Buthelezi for the award of the Swifambo “tall trains” contract, in his State Capture Commission’s report into PRASA.
In 2005, Buthelezi was appointed to the board of PRASA’s predecessor, the South African Rail Commuter Corporation. Then, he was appointed as chairperson of PRASA’s board, from its inception in 2008 until 2014.
In his outgoing letter in PRASA’s 2013/24 annual report, Buthelezi boasts of a company that is “resilient” and “stable”. He said that PRASA’s clean audit was a “testament to the hard work and focus of the Board in putting in place controls and governance protocols”.
The very next year, the PRASA’s “clean” audit proved paper-thin, with the publication of the Public Protector’s Derailed report, and the years that followed mocked the claims of stability and resilience in Buthelezi‘s boasts.
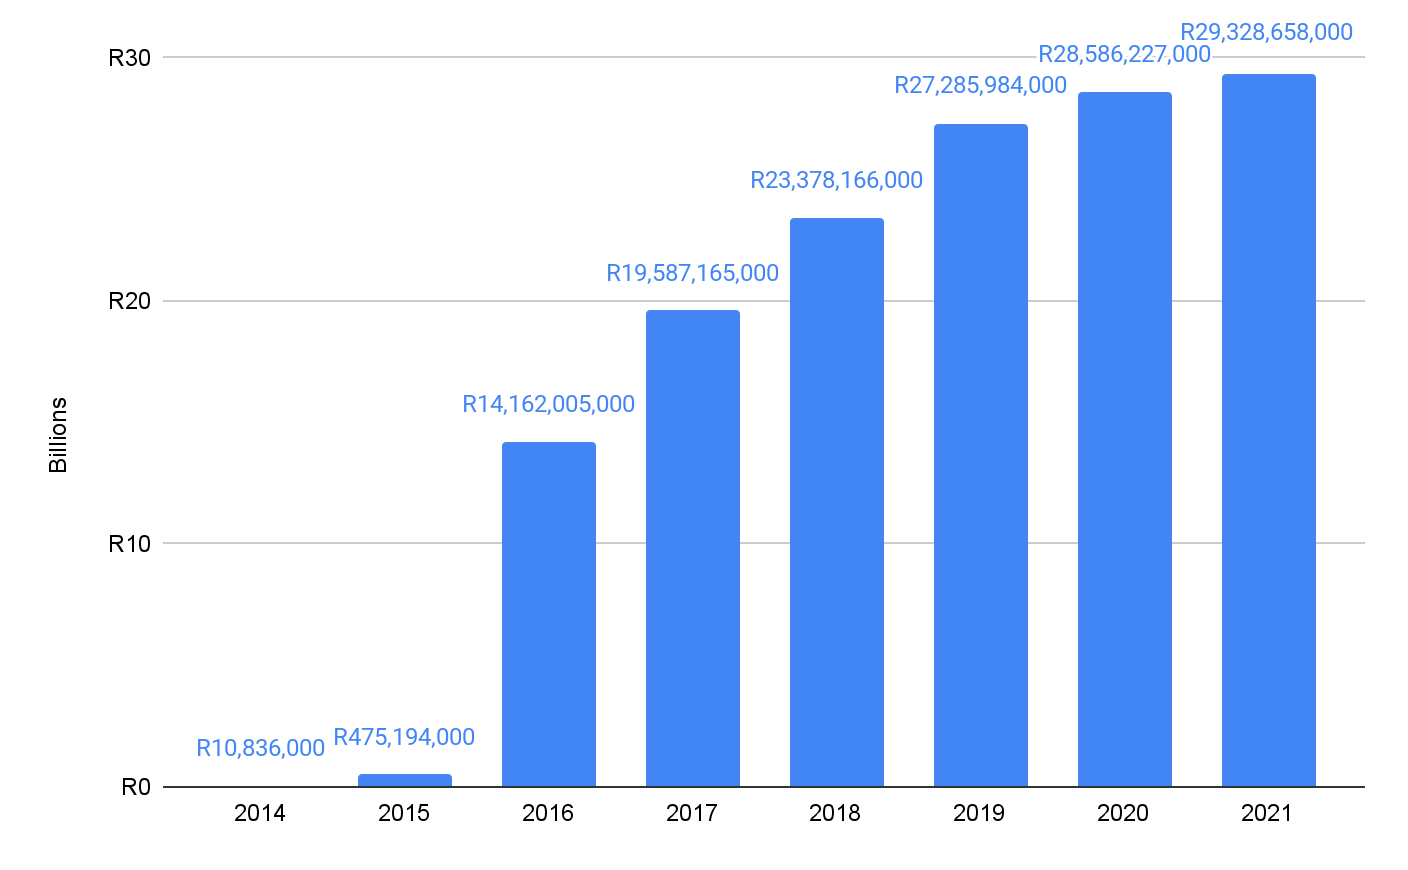
Graph 5: Balance of irregular expenditure. Source: PRASA annual reports
6. Commuters pay more for worse service
The graph below shows PRASA’s average fare revenue per trip.
The blue line is calculated from PRASA annual report data while the red line comes from StatsSA data from the 2020 and 2022 Land Transport Surveys.
The increases appear more or less in line with inflation until 2020, but then there’s a massive spike.
To make the calculation, we estimated the total passenger trip numbers for 2020/2021. We initially thought that the spike from R8 in 2020 to R13 in 2021 was unrealistic. But StatSA’s estimates of fare per trip for these years was significantly higher, at R14 for 2020 and R29 for 2021.
When we take into account that since 2020 PRASA now only issues single tickets, instead of discounted weekly and monthly tickets as in the past, the rise in fare per trip makes sense.
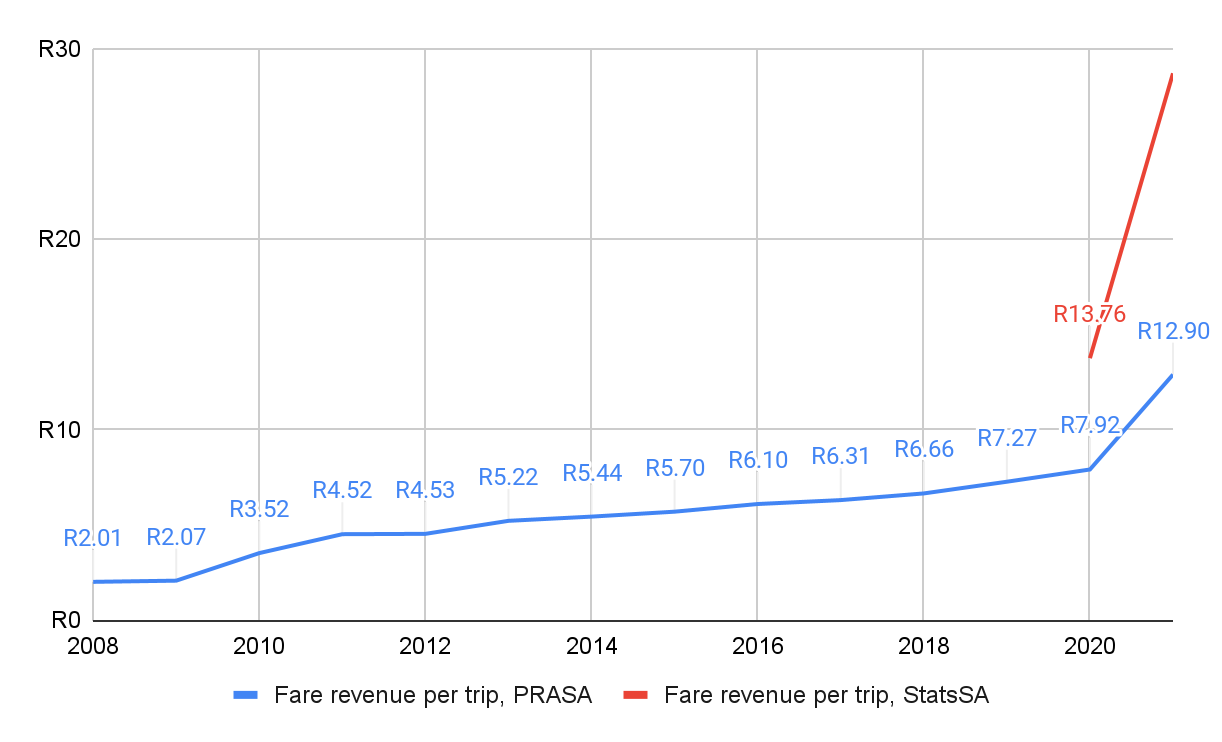
Graph 6. Fare revenue per trip. Data from PRASA and StatsSA
7. Cost to PRASA per trip jumped in 2019 - and then skyrocketed in 2021
The graph below shows how much a single trip (one person making one journey) costs, from different perspectives.
The blue column, tax per trip, shows the sum of subsidies received in a year, per passenger trip as declared in the income statement. The red column shows grants received from the government as declared in the cash flow statement, per trip. The yellow column shows the cost of running PRASA - the sum of all operating expenditure - per trip. The green column shows operating expenditure, less the revenue received from fares and rentals.
The rail agency has fixed costs that are difficult to reduce, like staff expenses, so when passenger numbers drop, as they did in the Covid years, you would expect the cost per trip to rise. But in the years before Covid hit, this cost was already rising out of control. From R10 per passenger trip in 2014/2015, it rose to R21 in 2016/2017, to R44 in 2018/2019, and R68 in 2019/2020 (years ending in March).
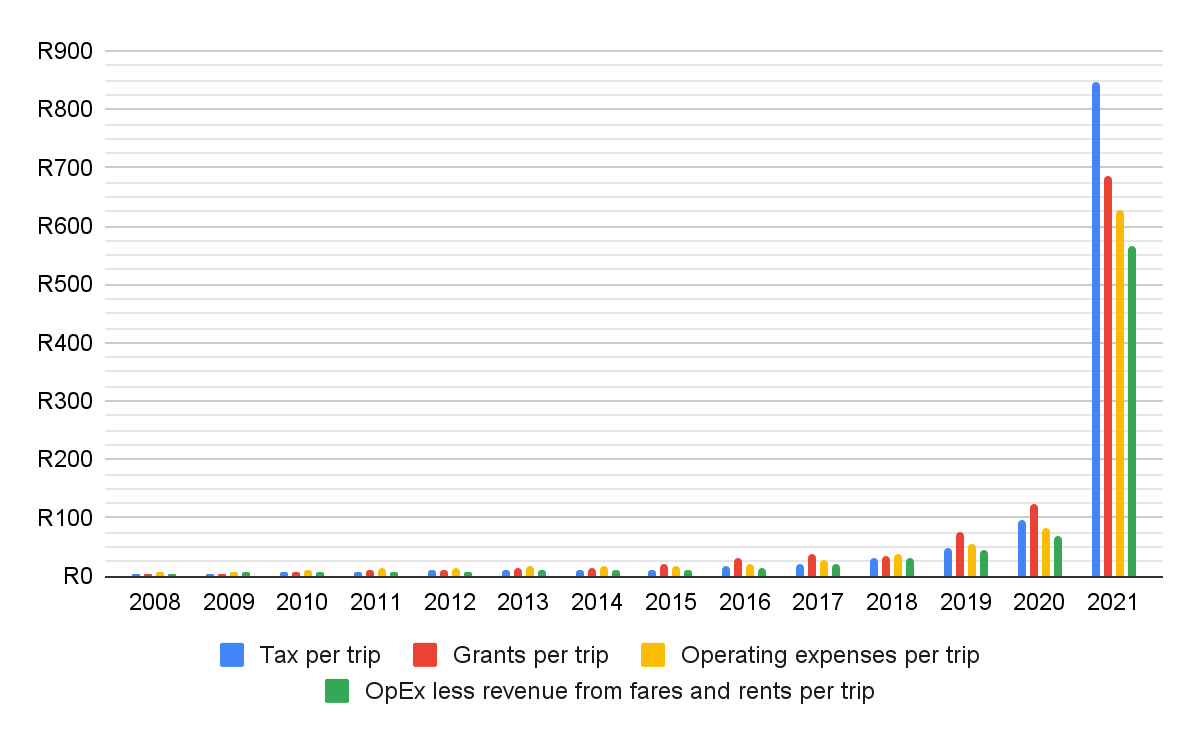
Graph 7. Cost per trip from different perspectives. Source: Our calculations from PRASA annual reports
8. PRASA operational costs dropped only because it has fewer trains
A superficial look at the graph below suggests that after years of rising operational costs, PRASA is getting these costs under control. But this is a mirage.
The red line shows two consecutive years, 2019/2020 and 2020/2021, when operational costs declined. The decline is not due to reducing staff costs, as the yellow line shows a gradual increase and then stabilisation in staff costs.
The notes to the annual reports show that the main drivers of the decreased costs are due to a decline in the number of trains running. This results in drops in the costs of fuel, security, and repairs and maintenance to trains and stations.
Without maintenance, there are simply not enough working trains to put on the tracks.
According to the 2020/2021 annual report, just 83 train sets were available by the end of the reporting period. In 2019/2020, there were 110 sets available, of which only 45% were at the normal length. In 2018/19, 183 sets, with a similar proportion running short. In 2013/14, by comparison, there were 288 sets available.
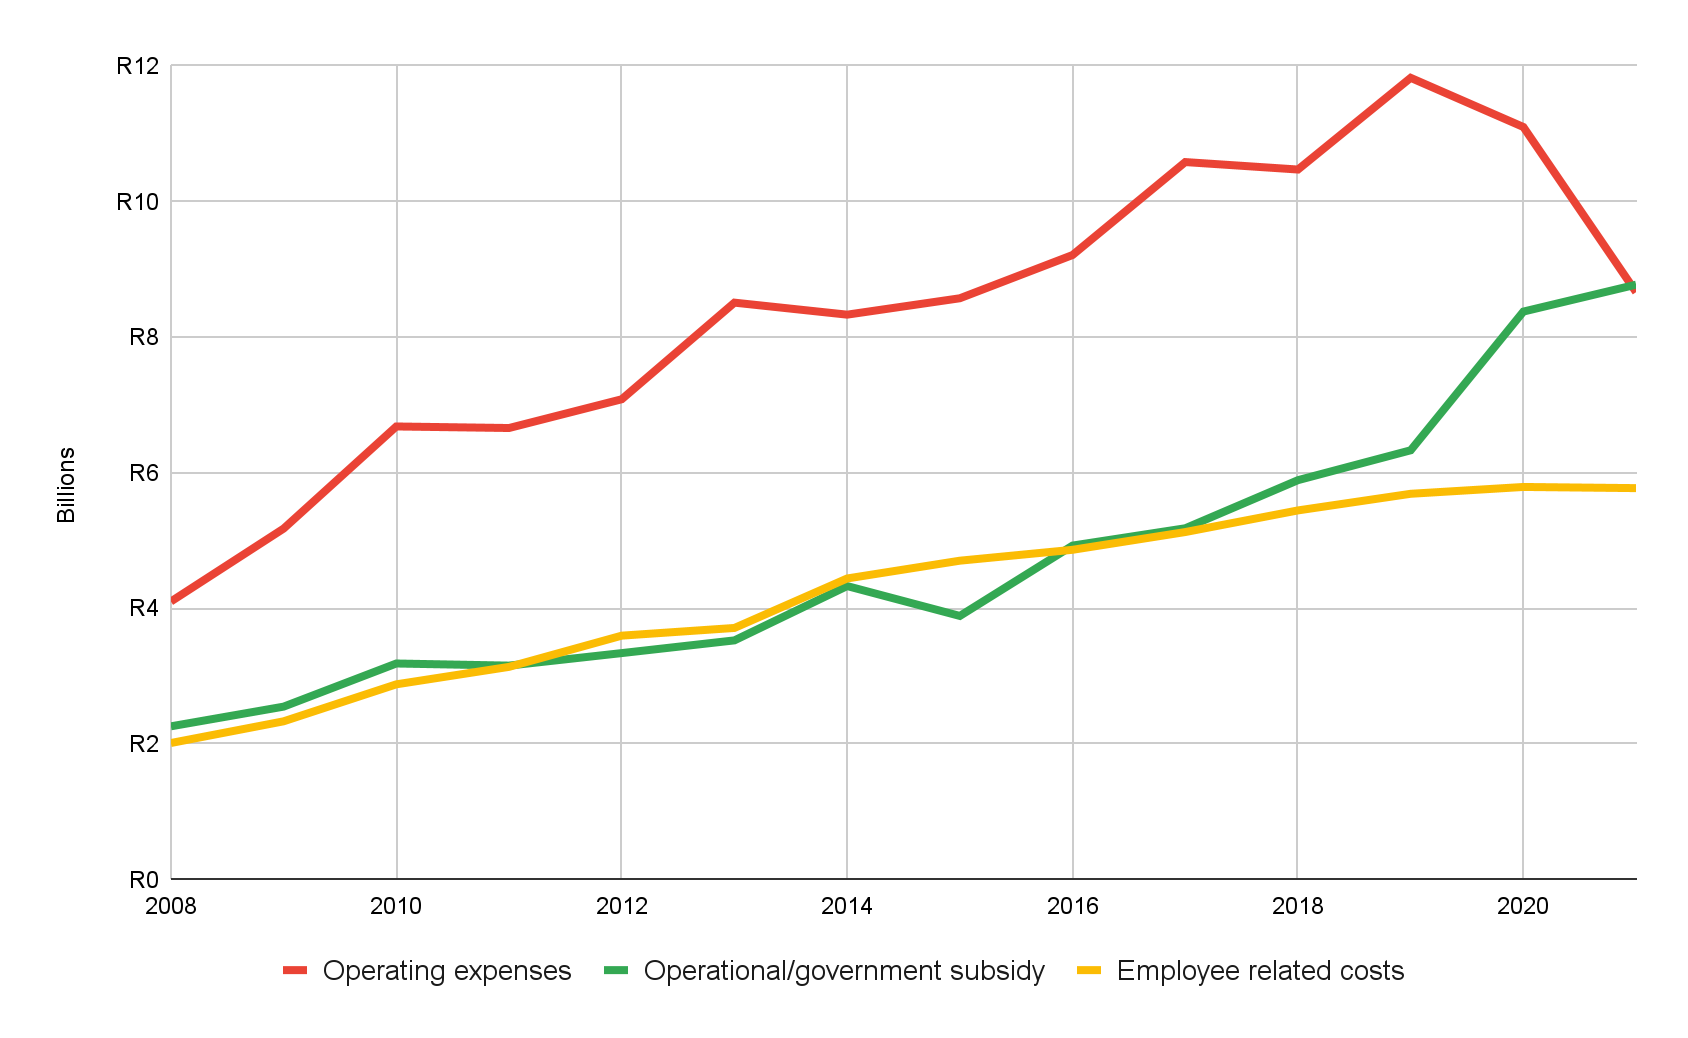
Graph 8. Operating expenses versus employee costs. Source: PRASA annual reports
9. PRASA’s investment has increased, yet the value of its assets is dropping
Perhaps this underspending and high cost to the public purse per trip could be forgiven if the public could be assured that the spending was going towards building railways infrastructure that could, eventually, accommodate millions of passengers per day.
Since 2008, PRASA has spent a total of R53-billion on property, plant and equipment, according to the annual reports. But the total value of its property, plant and equipment assets has not increased by that amount. Instead, the value of the core assets of the company grew at a slower rate than the money that was being invested.
Then, PRASA decided to cancel its security contracts without replacement in late 2019, and a catastrophic decline in assets followed.
The drop in value for 2019/2020 and 2020/21 may well be understated, because PRASA doesn’t actually know the value of its assets.
In a note to the annual report for the 2020/2021 the Auditor-General states that there was not “sufficient appropriate audit evidence that management had properly accounted for property, plant and equipment”.
Incredibly, PRASA has no fixed asset register, something which has been flagged by the Auditor-General for many years. Without a fixed asset register, PRASA is ignorant of the assets that it actually has.
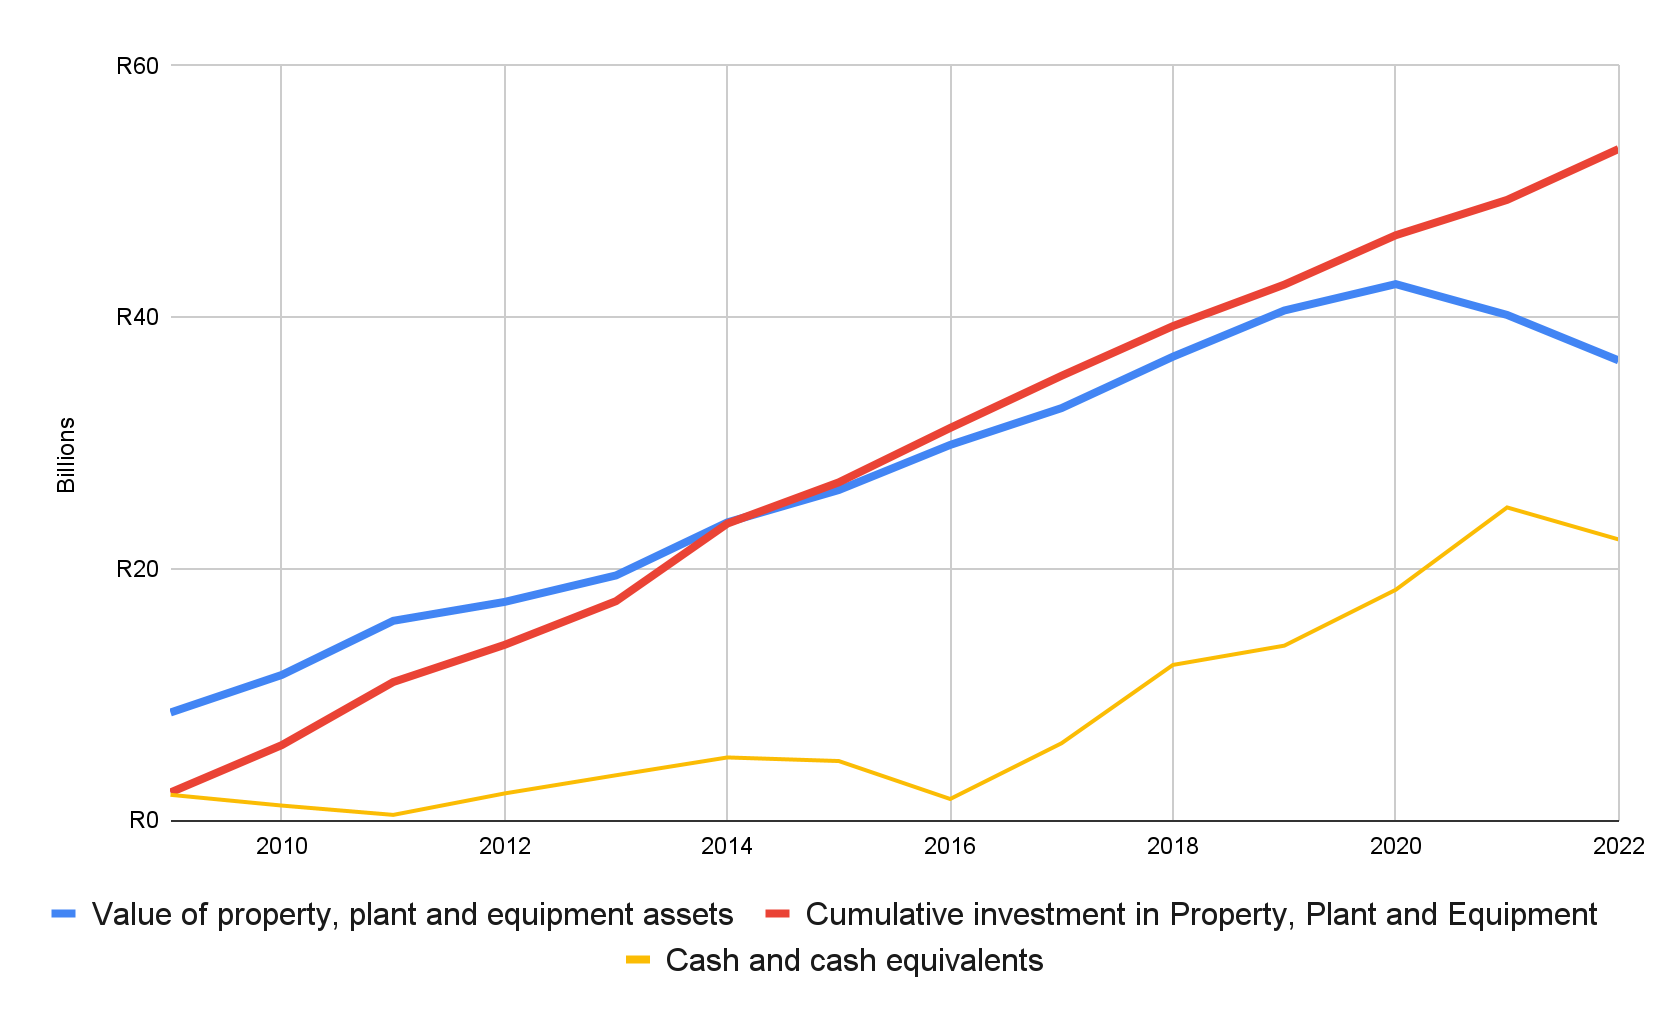
Graph 9. Value of assets versus investment in property. Source: Our calculations from PRASA annual reports
10. Minibus taxis are absorbing rail commuters
In the following two graphs we see the number of trips on different modes of transport used in the provinces that have commuter rail services, in 2013 and in 2020. (Cars are not included.) Minibus taxis have absorbed many rail commuters in Western Cape and Gauteng. The picture in the Eastern Cape and KwaZulu-Natal is less clear.

Graph 10a: How people travelled in 2013. Data from StatsSA National Household Travel Survey, 2020.
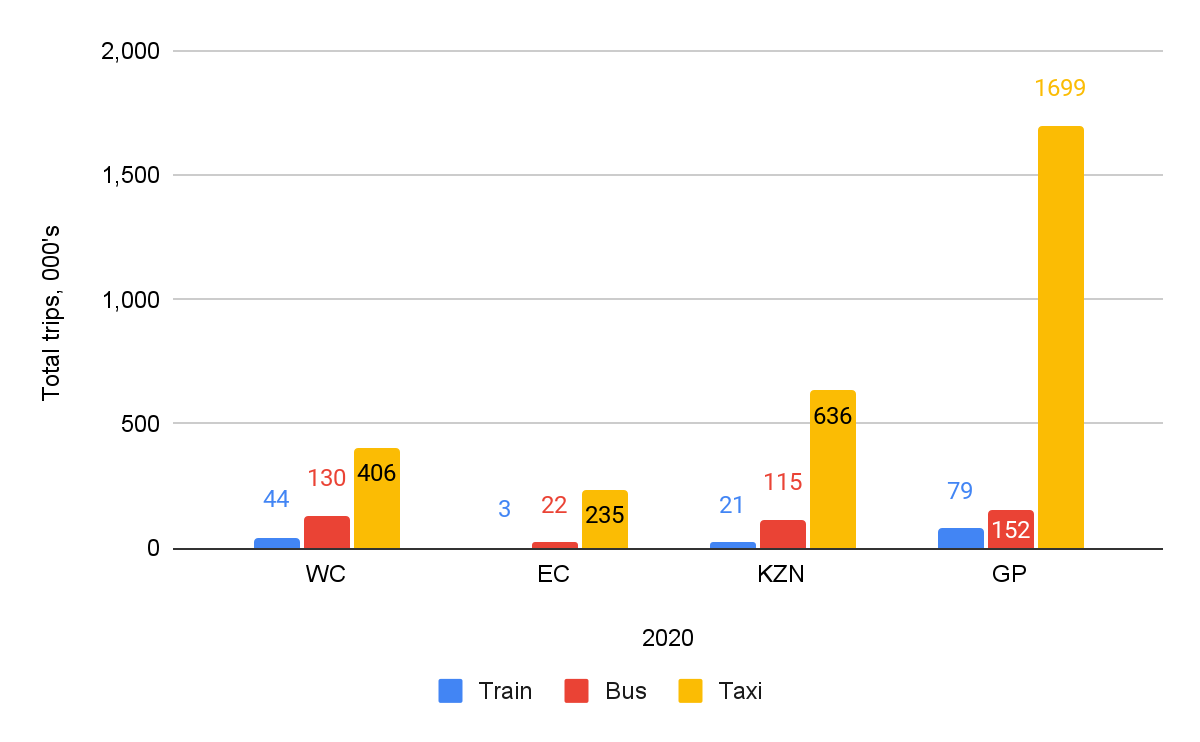
Graph 10b: How people travelled in 2020. Data from StatsSA National Household Travel Survey, 2020.
11. The shift away from rail comes at a high cost for commuters
The graph below shows that this shift from rail to minibus taxi has come at a very high price. In the Western Cape in 2020, the average monthly cost for a commuter on a minibus taxi was R636, in KwaZulu-Natal it was R731, while in Gauteng it was R1,198.
It is unclear whether the relatively high cost of train transport in Gauteng includes Gautrain fares, but nevertheless, the average cost per month to the commuter is R407 less for the train user than the taxi user in that province. In the Western Cape, the cost of a train per month is just over half of a month’s worth of minibus taxi fares.
Parliament (and the National Treasury) might be considering pulling money from PRASA, but fewer trains mean a poorer public. PRASA’s crisis is South Africa’s.
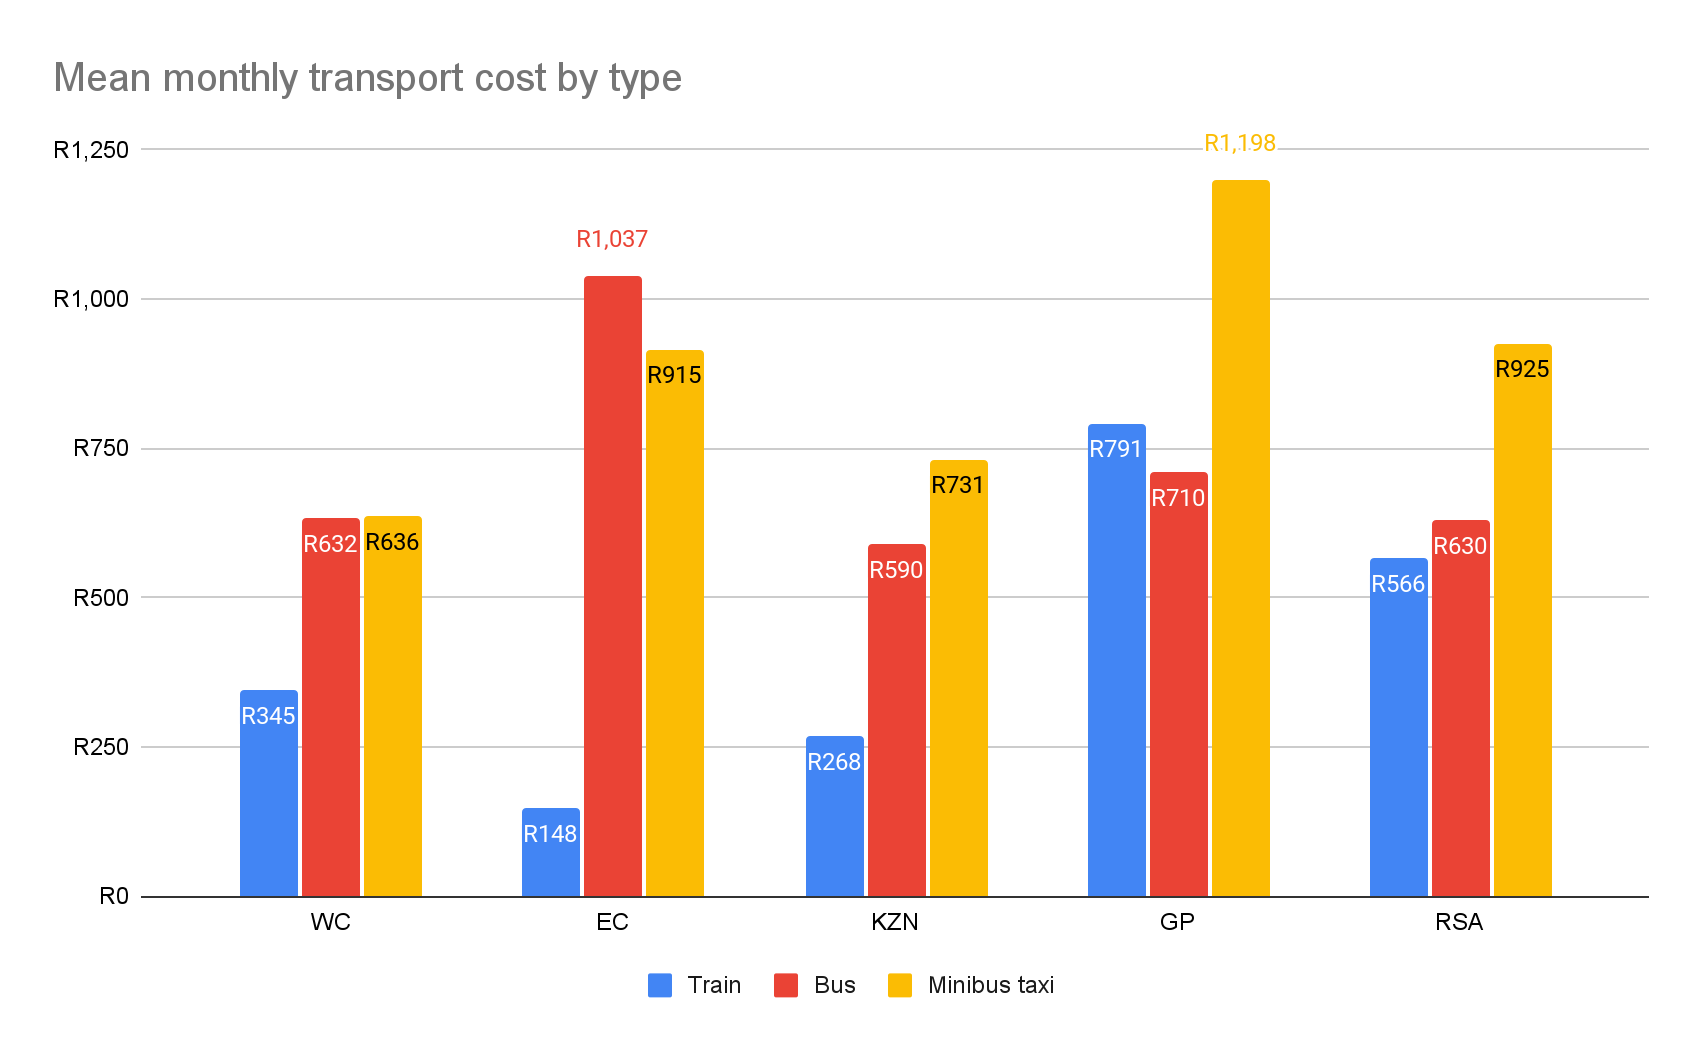
Graph 11: The cost of travel by mode of transport. Data from StatsSA National Household Travel Survey, 2020.
The graphs and data used in this article are available here: PRASA over time.
Support independent journalism
Donate using Payfast
![]()
Don't miss out on the latest news
We respect your privacy, and promise we won't spam you.
© 2022 GroundUp. This article is licensed under a Creative Commons Attribution-NoDerivatives 4.0 International License.
You may republish this article, so long as you credit the authors and GroundUp, and do not change the text. Please include a link back to the original article.
We put an invisible pixel in the article so that we can count traffic to republishers. All analytics tools are solely on our servers. We do not give our logs to any third party. Logs are deleted after two weeks. We do not use any IP address identifying information except to count regional traffic. We are solely interested in counting hits, not tracking users. If you republish, please do not delete the invisible pixel.