Is Cape Town’s drought the new normal?
Here is what climate science tells us
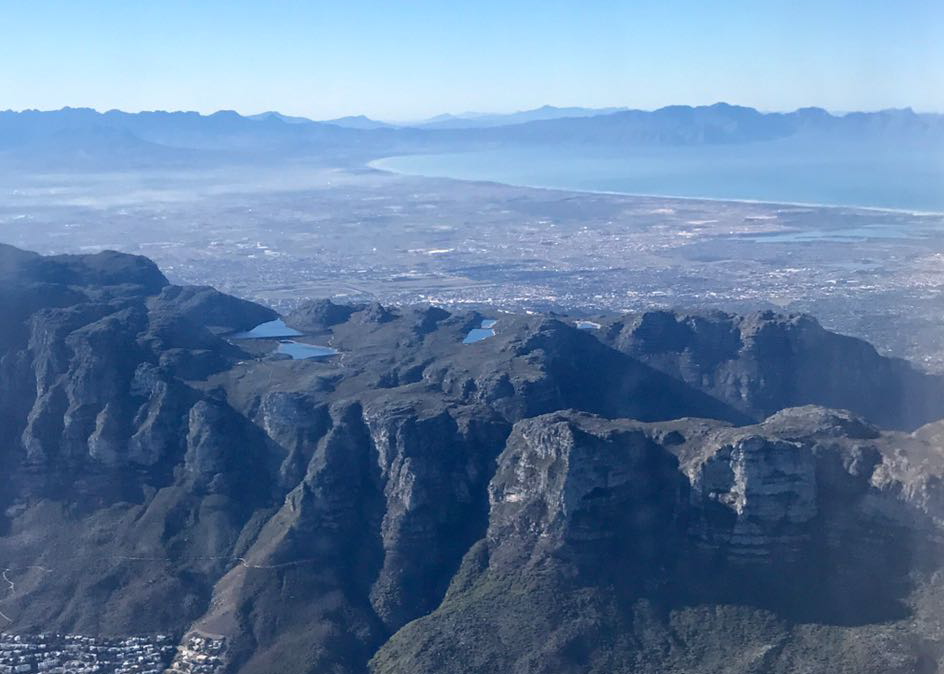
Aerial view of Cape Town. Archive photo: Brent Meersman
Journalists and the general public are asking many questions about the Western Cape drought. What is meant by a drought? Why is the drought happening? Where exactly is the drought occurring? Is this drought caused by climate change? Could it have been predicted? Should we not expect it given Cape Town’s climate?
More recently, however, questions tend to be about how wet the coming year is expected to be. Is it going to be as dry as this past year? Is this drought “The New Normal“?
Logically, people are also asking what is meant by the “The New Normal”? No, it’s not the title of a TV show, it’s what the City of Cape Town is asking us to get used to as far as future water for the city is concerned.
We often use the term “new normal” but do we really understand what we mean when we say it? The term implies that there is a change and the future will be different to the past that we have become used to. There was “old normal”; now something has changed and we have the “new normal”.
From a climate perspective we, again often implicitly, assume that the change in question is a result of human activity influencing the climate. What does it mean? What does the Mayor mean when she says: “Climate change means there is no more normal – we have seen that the rains will not come as it used to with our lowest rainfall on record in 100 years over the past two winters”?
Does it mean that this year’s drought will be a regular thing in the future? Will every future year look like this one? Or just some? Will there be wet years? Or never again? Will the dams ever fill? Or will we constantly hover around them being at best at 37% of full storage? Or even lower?
Let’s have a look.
Below is rainfall data for Altydsgedacht that we have used before to describe the severity of the drought. They span the period of 1920-2015, and we have added the last two years based on data from Cape Town airport. What we have is therefore a series covering 1920 to 2017. Why this station? Because we have it’s data at hand; it actually does not matter which station we use, as any would illustrate the point we want to make.
The current drought is clearly noticeable in this dataset: the last two points on the line (2017 and 2016) are actually the lowest in that record.
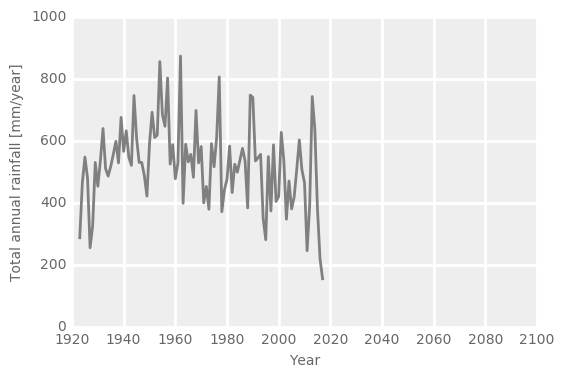
The graph also illustrates a couple of other characteristics of Cape Town’s climate. There is high year-to-year variability - i.e. every year is different, usually “jumping” from lower to higher, or from higher to lower between the years. But there are cases of two high rainfall years in a row (e.g. 1989-1990) or two low rainfall years in a row (2016-2017). There are very wet years (for example 1962 and 1977), and there are very dry years (2017, 2016, 2013). There is a period of seven wet years (1950-1957) but, interestingly, there is actually no extended period with only dry years. There appears to be a positive trend (i.e. gradual increase in rainfall) between 1920 and 1960, and then a negative trend between 1960 and 2017. The mean annual rainfall over the 1920-2017 period is 522mm/year.
This is what we call climate variability. And perhaps, there is some climate change there too, but let’s wait a moment before we jump to conclusions.
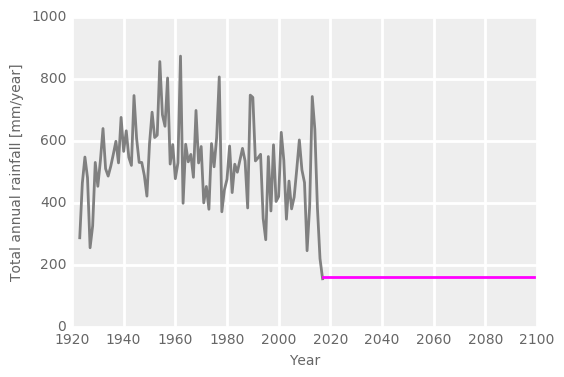
So what do we think will happen in the next few years? Can we consider the last three years to be an expression of a trend and extrapolate it into the future like so:
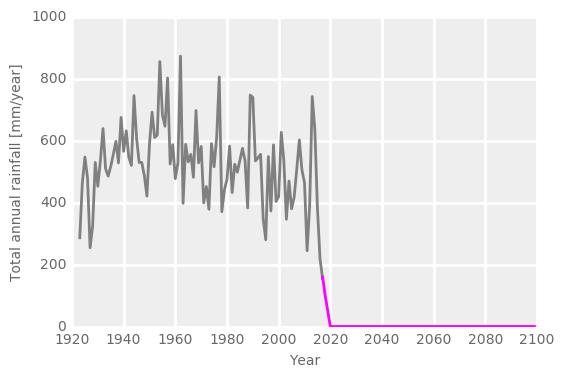
Or should we assume that Cape Town’s climate has changed and from now on we will have only dry years, like 2017:
Is The New Normal going to be one of the above?
Just looking at the graphs above most people’s rational guess would be: no, these futures are not realistic. There is no reason to assume an immediate disconnect of the patterns before and after 2017. Intuition tells us that such a disconnect cannot happen in the real world. But is there a scientific rather than experiential explanation of why not?
For this, we need to understand where rainfall comes from in general, and where it comes from in case of Cape Town in particular.
Capetonians know that winter rainfall is brought to our city by a series of cold fronts that sweep the region with some regularity — every four to seven days — between June and September. The cold fronts make up the core of Cape Town’s rainy season. The fronts result from cyclonic (clockwise) circulation around low pressure systems that form in the belt of westerly winds (the so-called westerlies) located in the mid latitudes (generally south of 35 degrees South). That belt of westerly winds moves north in winter, and south in summer. In winter, it is in a position that allows the cold fronts to reach and bring rain to the south-western tip of the African continent. In summer, the cold fronts still occur, but they are located well to the south of Cape Town, and rain over the ocean.
What drives the north-south movement of the westerlies? In a simple sense it is related to the strength and position of high-pressure systems located over the sub-tropics. In summer, when the southern hemisphere of the Earth is tilted towards the Sun, the southern tropics become zones of intense heating, strengthening and expanding the sub-tropical high pressure systems, and pushing the westerlies southwards. In winter, when the southern hemisphere is tilted away from the Sun, the sub-tropical high pressure systems contract, and the westerlies move north.
We have a year-to-year rainfall variability in rainfall because these moving high pressure and low pressure systems interact with each other, and with other systems around them in a not always regular manner. As a result they are sometimes stronger, sometimes weaker, sometimes located more to the south, sometimes more to the north, sometimes towards the east.
Simplifying things strongly: high rainfall years occur in Cape Town when the lows have really low pressure, and/or form very frequently, and/or when the westerly belt moves far north. Droughts occur when the situation is opposite. Importantly, there is a continuity of these conditions. We don’t just have high rainfall years, and low rainfall years. We have the whole range of years associated with in-between pressure levels and in-between positions of the westerlies.
Currently these variations and interactions are largely considered random and unpredictable with only weak links to predictable phenomena like El Niño. We can’t predict how they will change over the next year but we can observe and predict long-term changes to the average positioning of high pressure systems and the westerly wind belts.
So we can dismiss the two futures illustrated above as unrealistic:
-
Whatever happens, the Earth will not stop or change the way it tilts towards and away from the sun in summer and winter.
-
As long as it does that, there will be the winter-summer, north-south migration of the temperate westerlies.
-
Since the magnitude of that migration and thus the amount of rainfall delivered to the Cape varies continuously from year to year, we can expect that even if there are any changes in the climate system, that variation will continue in the future.
-
That variation may change though: the westerlies may be pushed further south in general, and cease reaching the latitude of Cape Town, but it is unlikely for this change to occur within the span of several years, without a large-scale climate event which shifts the global climate, e.g. the collapse of the Greenland or Antarctic ice sheets. More likely we will see this process take several decades perhaps. If so, then in the next years we will still see year-to-year variability in rainfall, perhaps with the mean trending towards a lower (near zero?) value.
If we assume that Cape Town’s climate is getting drier (let it be an assumption at the moment, we will come back to it later) what we may (perhaps) expect is something like this:
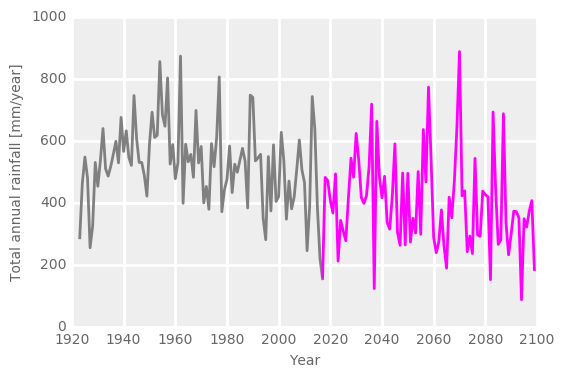
In the above figure, rainfall variability in the period after 2017 is similar to that in the pre-2017 period, and there appears to be a downward trend. So rains are progressively lower. But note that there are still wet years. Perhaps even wetter than the wettest we’ve had so far. The trend is likely due to human-caused climate change. The variability is, well, due to climate variability.
The future in the figure above looks realistic, but it is not real. The data for the future in this graph are made up. It does not show the actual future. We expect this type of rainfall variation but not necessary this sequencing of wet and dry years. As we’ve mentioned above, unfortunately, we have no ability to predict a particular sequencing of wet and dry years in the future, not even in the next two years.
Yet, we do run climate models to obtain long-term projections of future climate. There are currently some 50 of them at various institutions across the world. So what gives? Simply, global climate models are used to project climate, i.e. long-term mean conditions, not conditions in a particular year which, as explained above, are unpredictable. But the information about long-term climate is relatively robust in climate model projections.
To illustrate what future climate models project for Cape Town, below we show total annual rainfall derived from 16 global climate models. In the figures, yellow dots mark years that have rainfall of magnitude corresponding to that recorded in Cape Town in 2017, i.e. years of drought.

Every projection is different. There are different patterns of succession of wet and dry years. In some projections there are many years of drought. In some there are few. The important thing is that no single projection is likely to represent the actual future. But all together they represent what the future is likely to be like.
Not a permanent drought. Dry years and wet years. And “moderate” years in between. But the chance of dry years increases as we go towards the end of the century. And the chance of wet years decreases as we go towards the end of the century. That’s our New Normal, at least on the rainfall side.
Support independent journalism
Donate using Payfast
![]()
Don't miss out on the latest news
We respect your privacy, and promise we won't spam you.
Letters
Dear Editor
I really appreciate your article, but can you put under your graphics the type of model used, and if you can a better granularity on the year axis to have a better visual clue.
Dear Editor
It's proved surprisingly challenging to get a clear understanding of the current water crisis and potential future scenarios from articles on the web. So it was a pleasant surprise to read such a well written and articulate fact based summary covering the major factors driving waterfall levels and what we're likely to see in the future in CT.
So thanks for the great work.
Dear Editor
I was particularly struck by the fact that there is little or no agreement between these projections.
That gives me very low confidence in any of them!
Dear Editor
While we cannot control when the rain comes or how much of it will come, we can control how we collect, store, and use this resource. Only then will we be able to cope through a series of drier seasons.
We should clean our dams now while they are accessible, we should increase dam capacity, as we're doing in Clanwilliam, we should remove alien vegetation, and only plan water-wise gardens and (where really necessary) water-wise lawns. And water usage should be charged appropriately to curb unnecessary usage. All houses that have a pool must prove that they have the ability to collect water to top it up. All homes must prove occupancy levels and it must be specified on the municipal bill to calculate the appropriate water allocation before premium tariffs apply.
Dear Editor
Here an opinion from one of our more knowledgeable members of our Facebook group. His opinion differs a bit from yours. I quote "This is a good view. There is just one point over which I must query. The sub-tropical High pressure belt does not intensify in summer. It is actually quite the opposite. That is because in the colder months the air is more dense. We always get higher pressure readings in winter than summer. But they move between the seasons. It is the position, not the intensity, that determines the sweep of the frontal systems. And stronger Highs lead to stronger convergence, and thus stronger fronts with heavier rain." Could you explain this again taking into account the different viewpoint.
© 2017 GroundUp. 
This article is licensed under a Creative Commons Attribution-NoDerivatives 4.0 International License.
You may republish this article, so long as you credit the authors and GroundUp, and do not change the text. Please include a link back to the original article.