How severe is the drought? An analysis of the latest data
Facts are few, opinions plenty, on the cause of the water crisis
Editor’s summary
- Piotr Wolski, a water scientist at UCT, has used the latest rainfall and best available weather station data to compare the current drought to past ones.
- The data shows that the drought over the water catchment area is the worst on record over one- and three-year periods. Rainfall in 2017 was especially poor.
- This kind of drought is expected once in 300 years (90% confidence interval: 105 to 1,280 years).
- The drought in the city itself is severe, but not the worst on record. Very little of Cape Town’s water is sourced from in the city itself.
- There is a trend towards lower rainfall over the past 84 years in the catchment area. This may be due to human-caused climate change.
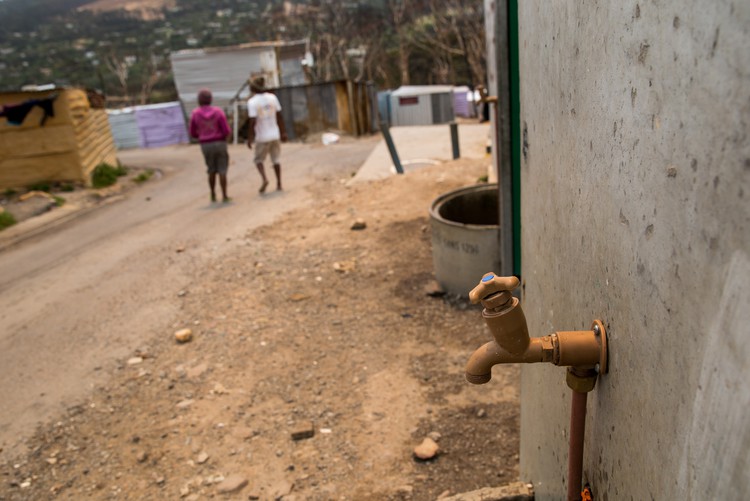
The causes of Cape Town’s water crisis are hotly contested. There is a drought, of course. But there are also other reasons brought up in the public discourse, particularly on social media, such as population and water demand growth, unreported agricultural use, invasive species sucking out water in catchments, poor planning and mismanagement of water supply system, and lack of foresight in development of new water sources. Are these significant contributors to the shortage? It’s very difficult to say without dedicated, comprehensive analyses. But facts are few, opinions plenty.
Few people question whether there is a drought: what is questioned is its severity. This has important implications. If the drought has been mild, then it should not have resulted in a major water crisis. If it has been severe, then it has just been a bad ticket on the climate lottery, and all the other factors would be at most aggravating factors but not the main cause. The issue is obviously socially tense, creating wedges between authorities and citizens, between those who institute water restrictions and those who have to bear the brunt of them.
In this article I look at the most up-to-date rainfall data to assess how severe the current drought is. I have tried to answer that question before. But that article was based on very limited data, and was carried out well before 2017’s rainy season had finished. Now I have a more comprehensive dataset, which provides an opportunity to perform a more robust assessment.
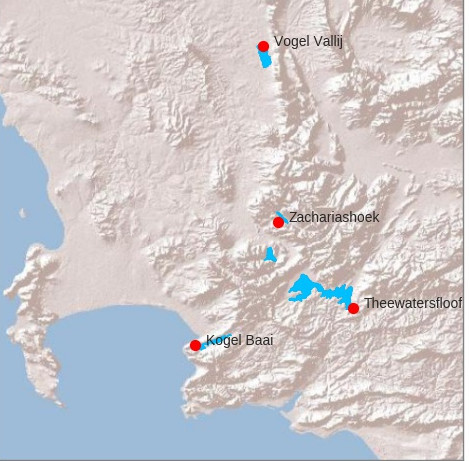
There are a number of stations that measure rainfall in the vicinity of the Western Cape Water Supply System (WCWSS) dams. Data for them are available from the Department of Water and Sanitation (DWS) website.
Not all stations in this dataset have good records; there are numerous gaps. It appears that nine stations have data available for recent years, but four are located in the region of the WCWSS dams, and have no significant gaps or systematic errors from 1981 through 2017. Those stations are: Vogel Vallij, Zacharashoek, Theewaterskloof and Kogel Baai.
This is annual rainfall at these stations for 1981 to 2017:
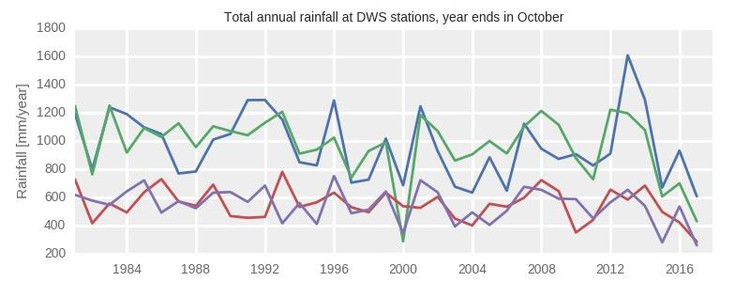
Note that the year in the above figures is taken to be between November and October. This is because October is more or less the end of rainy season, and the last month when an increase in dam levels may be recorded. Also, because at the time of writing this, data are available only till October 2017. Putting the end of the year in October allows me to use the 2017 data without estimating rainfall in November and December.
To make further analyses more robust, instead of analysing data from individual stations, I calculated their simple average. And to account for the fact that the drought is likely of a multi-year character, I created plots showing two-, three- and four-year average rainfall:
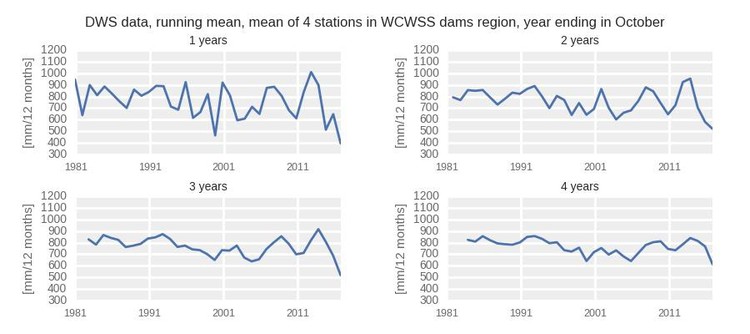
These plots tell a consistent story: 2017, as well as the preceding two-, three- and four-year average rainfall in the region are the lowest since 1981. What it means is that the 2017 drought was at least as rare as once in 36 years.
But looking at the last 36 years is not enough. We know that before that there were droughts in the 1920s and 1970s. We need to compare the current drought to the old ones. Can we go back further in time?
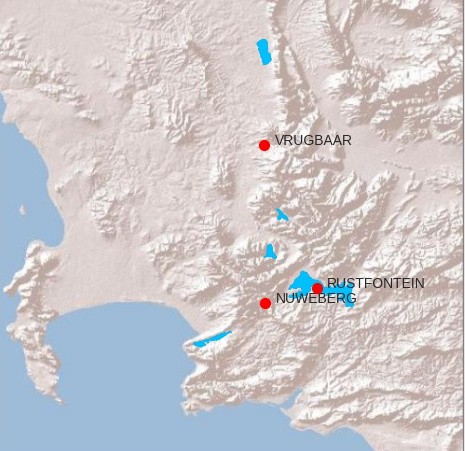
The DWS data do not span further back. But data from other sources do. The rainfall data from the South African Weather Service (SAWS) for some stations in the Western Cape go as far back as the late 1800s. Unfortunately, there isn’t any overlap between the DWS and SAWS rain stations, so we cannot simply extend the record of the four stations used above. We need to repeat the analyses on the entire SAWS dataset. If available SAWS data are screened in a similar manner as the DWS data were (i.e. for continuity and consistency of record), we get five stations with data covering the period 1933 to 2017. Only three are located in the WCWSS dam region: Vrugbaar, Rustfontein and Nuweberg.
Similarly to the above analysis, I plot below the mean rainfall for the three stations:
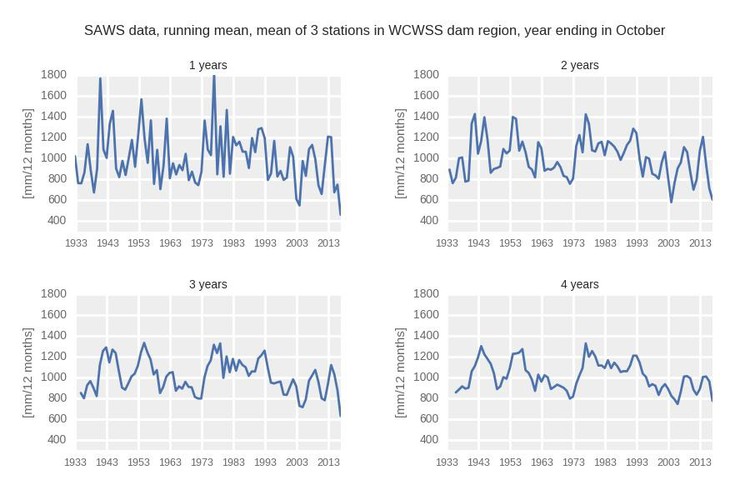
The figures show that 2017 was the lowest rainfall year since 1933. They also show that the mean rainfall in the three preceding years, 2015-2017, was unprecedented. However, the two-year mean as well as the four-year mean leading to 2017, were not the driest.
We can even go back further in time to 1920, but then we can rely on one station only (Vrugbaar). This is how plots for this station look:
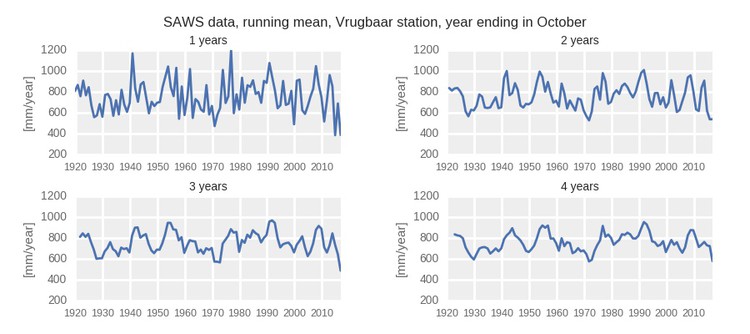
Again, the 2017 rainfall for that station, and importantly the mean of 3-years prior to 2017 were lower than in any period experienced by this station since 1920.
Interestingly, if you look at the long-term rainfall data for the stations located near the coast, the situation is slightly different:
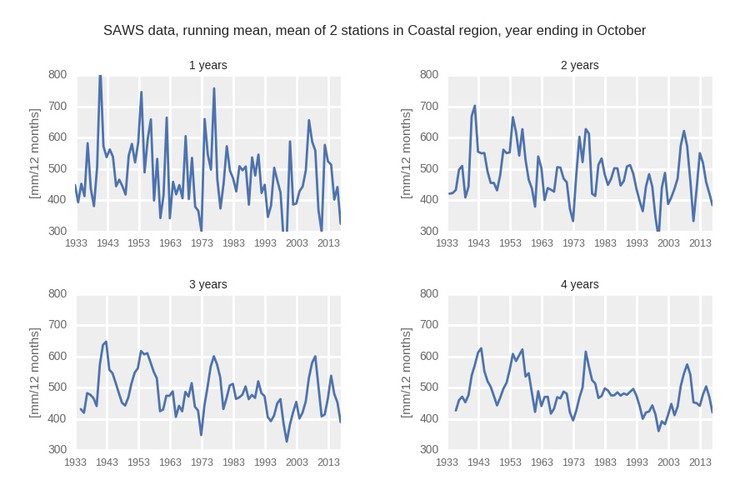
Here, although relatively bad, 2017 was not – either alone or in combination with preceding years — the driest on record. But this is not the area where most of our water is supplied from.
So the long-term SAWS data from the WCWSS dams region shows that 2017 and the period 2015 to 2017 were the driest since 1933. This translates into a drought return period of once in 84 years, possibly rarer. But how rare exactly? The statistical analysis I have done to calculate this are explained in my more detailed blog version of this article. My findings are that this kind of drought occurs once in 311 years with a 90% confidence that it falls between 105 and 1,280 years.
This is pretty rare and actually in the same range as the earlier estimates.
Of course, one may question that result in many ways. Are the stations used representative? Perhaps if we had a different set of observations we would get a different result? Does it make sense to use the average of several stations in the analysis? Perhaps there are errors in data?
I think this dataset is robust. I have taken care in the preparation of the dataset to find continuous, long-term data. Using averages of several stations reduces the chance that data errors affect the result.
The drought, as manifested by rainfall in the region of WCWSS dams, is indeed very rare, and very severe. Importantly, the analyses reveal that the drought was likely less severe in the coastal plains and in Cape Town itself. A possible reason for that might be a weaker penetration of cold fronts that bring winter rainfall to the region into the higher and distant inland regions.
Before I conclude this story – one more figure to think about:
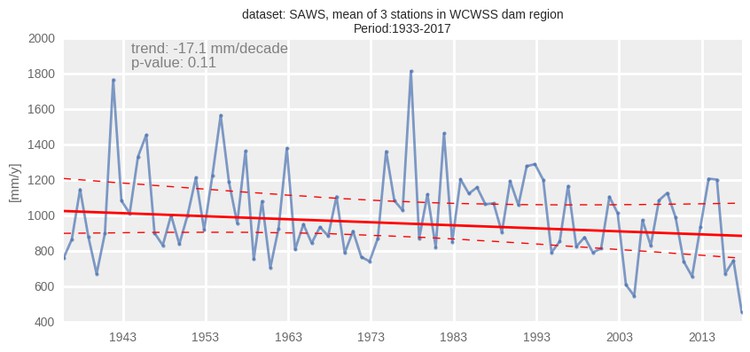
This figure shows a trend in rainfall in the WCWSS region over the last 84 years. That trend is towards lower rainfall and it has a relatively strong magnitude – 17mm per ten years. It is barely statistically significant, though. The important thing is that this trend may be an expression of human-caused climate change, and may be affecting the magnitude of droughts. Simply, if that trend was not there, the 2017 drought would likely be less severe.
In summary – the analyses presented above, based on the best rainfall data available at this time, show that the drought, manifested through low rainfall in 2015 to 2017, was very rare and severe.
Acknowledgements to SAWS and DWS for data, and Chris Jack and Stefaan Conradie (both CSAG/UCT) for valuable discussions.
A more detailed version of this analysis has been published.
Support independent journalism
Donate using Payfast
![]()
Don't miss out on the latest news
We respect your privacy, and promise we won't spam you.
Next: No compensation for man after work accident
Previous: Soweto learners protest state’s failure to fix school
Letters
Dear Editor
Thank you for interesting analysis.
Just a couple of questions from this layman:
Can one forecast on past trends and on the data available (a) what the likelihood is of above average rainfall in the WC in 2018 and (b) if heavy rain is likely, from the monthly data how early in the year these heavy rains may fall following a three-year lower than average rainfall? Or is this totally random?
Thank you.
Dear Editor
Thank you for publishing this, but I note that a lot of the data begins in 1933. This was the end of the 'great drought' experienced in Cape Town, from 1928-1933.
It would surely have been far more helpful to have data from 1928. The researcher has thus omitted the most important 'drought' period, except for one data set.
Furthermore, the current 'drought' isn't showing significantly lower rainfall that before, is it? It's a few percentage points at most.
So when do semantics inform science? Wouldn't it be better to say, 'this is an average 12 year drought, maybe slightly worse than usual, but we can't say if it's really worse than the 1928 drought?'
GroundUp Editor's Response
In response to Lorna Jones, Piotr Wolski writes:
Extrapolation of a trend is possible, particularly if we know what is the driving force behind it. In this particular case we suspect that it is anthropogenic climate change, so it is not likely that the trend will get reversed in the next couple of years. However, the trend explains very little of the overall variance in data. So any prediction based on the trend will not be very accurate. In other words, the current drought has not been caused by the trend; the trend only magnified it. Similarly, the rainfall in the forthcoming season, and in the seasons following it, will be affected by the trend, but only so slightly. The actual magnitude of that rainfall will be determined by factors that are independent of the trend.
At this stage, we have a relatively good understanding of what atmospheric processes and factors affect the onset and magnitude of rains in the winter rainfall region, but a very limited ability to forecast them. Thus, from a practical point of view, at this stage we have to consider that indeed, it is a coin toss between early/late or wet/dry rainy season. Perhaps we will be able to tell more closer to the actual season, i.e. in May/June.
Dear Editor
I come from Perth, a city of 1.6 million on the south western tip of Australia - with a climate almost identical to Cape Town. Originally, our city relied 100% on rainfall flowing into our dams.
However, this all changed when we realised in the 1990's that our climate was changing permanently. We now only get 10% of the stream flow that was flowing into the dams for the first 70 years of last century.
The most illuminating graph can be found here: https://www.watercorporation.com.au/water-supply/rainfall-and-dams/streamflow/streamflowhistorical.
If Cape Town is experiencing a similar trend then this would mean a total change to where you get your water. I trust the lessons learnt in Perth can be applied to Cape Town.
James Marshall
Water Engineer
Dear Editor
Since Cape Town lies in an area prone to dry spells, one might presume that the city would be prepared for such eventualities. But that appear to be not the case. One factor should be obvious: population growth.
From worldpopulationreview.com:
Year Population Growth(%) Growth
2030 4,322,000 5.65% 231,000
2025 4,091,000 5.98% 231,000
2020 3,860,000 2.22% 84,000
2018 3,776,000 3.17% 116,000
2015 3,660,000 9.42% 315,000
2010 3,345,000 10.54% 319,000
2005 3,026,000 11.45% 311,000
2000 2,715,000 13.41% 321,000
1995 2,394,000 11.09% 239,000
1990 2,155,000 11.95% 230,000
Take a finite resource and distribute it to twice as many people without efforts to increase that finite resource and you might, just might find yourself in a world of hurt.
© 2018 GroundUp. 
This article is licensed under a Creative Commons Attribution-NoDerivatives 4.0 International License.
You may republish this article, so long as you credit the authors and GroundUp, and do not change the text. Please include a link back to the original article.