Cape Town’s beaches are dirtier than they seem
Several beaches were closed over the holidays, but test results show that water quality at some other beaches is even worse
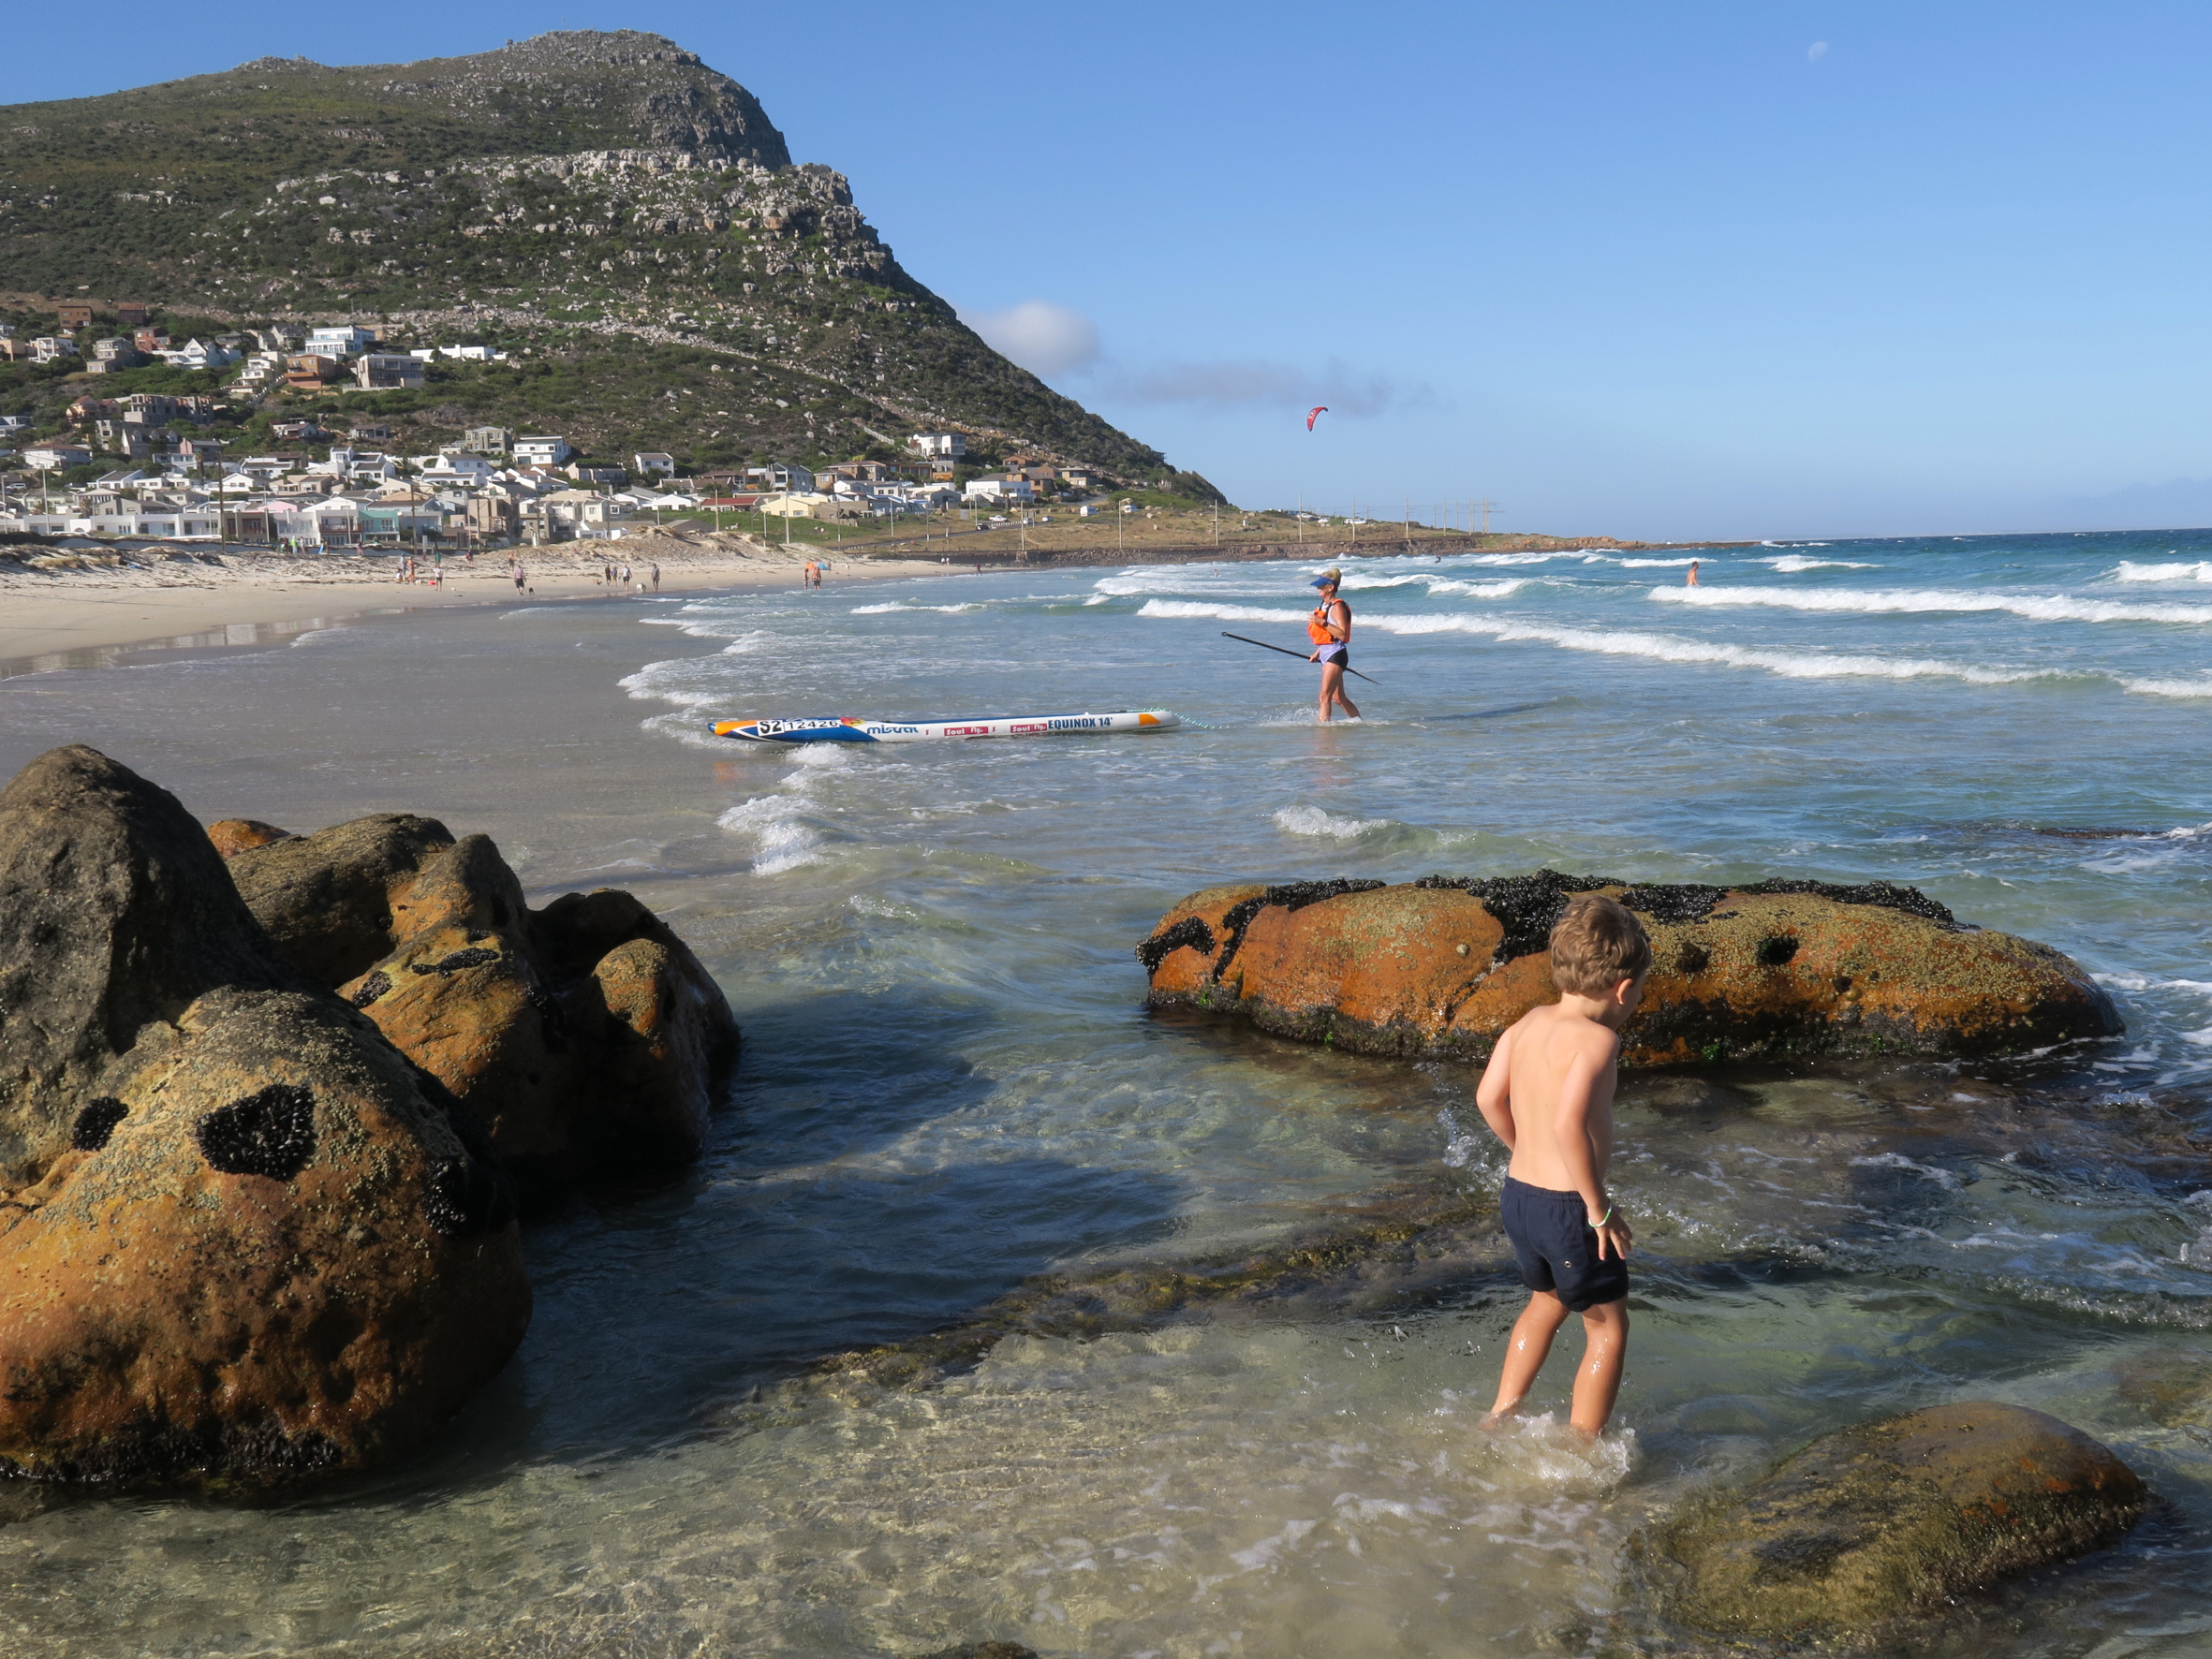
In December, Glencairn beach, popular with swimmers, dog-walkers, and watersports enthusiasts, was one of a number of beaches polluted with faecal bacteria levels higher than sewage treatment plants are allowed to discharge. Photo: Steve Kretzman
- The City of Cape Town has been quick to close beaches to protect swimmers following sewage spills.
- But tests show that at several beaches which were not closed, the water is highly polluted.
- Activists are concerned that the City’s routine coastal water quality testing is inadequate.
At least eight Cape Town beaches were closed during the December and January festive season after sewage spills were reported. But water test results show that several other beaches were also too polluted for safe swimming.
Many of the beaches were closed when sewage pump stations could not pump out incoming sewage during load shedding. After continued water quality testing for the presence of E. coli, most of the affected beaches were opened within a day or two. Chair of the mayco committee for water quality, Alex Lansdowne, said then that the maximum E. coli level was 500 colony forming units (cfu) per 100ml, and as soon as tests showed E.coli was lower than this, the beaches were reopened.
The City takes coastal water quality samples every two weeks, and tests are done not only for E.coli but also for the presence of enterococci, a more virulent strain of faecal bacteria. The limit for safe swimming is 200cfu of enterococci per 100ml.
However, an examination of the fortnightly coastal water quality test results over the periods 6 to 8 December and 13 to 15 December – the latest available on the City’s data portal - showed 21 of 88 coastal monitoring points had enterococci levels above 200cfu/100ml. Of these, 11 were over 1,000cfu/100ml, which is the maximum number of faecal coliforms (bacteria found in sewage) allowed in treated sewage released from sewage treatment plants, according to the national Department of Water and Sanitation.
This would imply that it was safer to swim in the discharge from a properly functioning sewage plant than at these beaches at the time the samples were taken.
Swimming or surfing in water with high levels of faecal coliforms can lead to gastrointestinal illness (tummy bugs) and ear, nose, and throat infections. Children and immuno-compromised people are particularly at risk.
Of the 11 monitoring sites where pollution was higher than levels allowed for treated sewage, eight were popular beaches:
- Strand at Murray Road (1,300cfu/100ml);
- Maiden’s Cove tidal pool 1 (1,986cfu/100ml);
- Maiden’s Cove tidal pool 2 (>2,419cfu/100ml);
- Lagoon Beach, Milnerton (>2,419cfu/100ml);
- Gordon’s Bay (1,553cfu/100ml);
- Glencairn beach (1,553cfu/100ml);
- The Kom, Kommetjie (>2,419cfu/100ml);
- Long Beach, Kommetjie (1,120cfu/100ml);
- Frank’s Bay, Simon’s Town (1,986cfu/100ml)
As far as can be determined, none of them, with the exception of Lagoon Beach at Milnerton, which has been polluted for at least three years, had signage warning beach goers that the water was unsafe for swimming or playing in.
In response to GroundUp’s questions, the City said it would look into the records “to determine whether pollution incidents occurred at these beaches mentioned in this media enquiry”.
Trend analysis
The City also said coastal water quality was “not an absolute science” and real time water quality measures did not exist, as laboratory results “take days”. In line with the National Coastal Water Quality Guidelines, coastal water quality was “an estimation of risk determined by looking at the last or previous 24 results taken over a rolling period of 365 days”. The water quality was then rated as poor, sufficient, good, or excellent.
“The trend analysis approach analyses long-term trends over 365 days and is a much more reliable tool to determine the overall water quality for a recreational area,” the City said.
This trend analysis was formerly available on the City of Cape Town website. But it has been taken off because the City’s Scientific Services Laboratory stopped testing for enterococci in May last year “due to the quality concerns of the agar media used in the enterococci analysis”. These concerns arose after independent tests at Rietvlei found the City lab results to be skewed too high.
The City has appointed an external provider, A.L. Abbots & Associates, and the 365-day trend analysis is being updated.
A tick-box exercise
Community activist Caroline Marx, who sits on the mayoral advisory committee for water quality, said it appeared the coastal water quality tests were little more than “a tick-box exercise”.
Marx has been at the forefront of the fight for the cleanup of the highly polluted Milnerton Lagoon, and helped establish non profit company Rethink the Stink and the Facebook group for responsible wastewater management.
She said there didn’t seem to be any follow-up when water quality test results showed consistently high pollution at the beaches. “What action is being taken as a result?” she asked.
“Where is the website where visitors can look to see whether the beach is fit for swimming?”
Marx welcomed the fact that water quality test results were available to the public. But, she said, the data was highly technical in nature, and determining where the samples were taken required cross-checking coordinates on a programme such as Google Earth. Additionally, the length of time it took to publish the results meant they were of little use to the public. On 30 January, the latest test results were from 15 December, making them a month-and-a-half old.
Hidden data
Jackie Whales, chair of Friends of the River in Hout Bay, said when the Hout Bay beach was closed on 10 January after sewage pollution due to blocked stormwater pipes, City officials were at the beach testing the water every day. “They were very good,” said Whales.
She said engagement with the City had improved since Mayor Geordin Hill-Lewis had shaken up the water and sanitation department, but the data portal where water quality results were posted was very difficult to navigate. She said the organisation was thinking of appointing someone to sift through the relevant data and present it.
Senior lecturer emeritus at Stellenbosch University’s Department of Global Health Dr Jo Barnes said pollution at city beaches had “been happening for a long time” but City officials seemed to focus only on pollution caused by loadshedding. Though the authorities had been quick to close beaches when loadshedding led to sewage spills, they had remained quiet about pollution at other beaches, said Barnes.
Barnes said the water quality testing limit of 2,419cfu/100ml for enteroccocci also disguised the extent of the pollution. At Maiden’s Cove tidal pool, for instance, which was popular with families and children, the City found enterococci levels to be above the limit of 2,419cfu/100ml, but how much higher is not known. The level could have been much, much more than that, putting people’s health at serious risk, said Barnes.
Support independent journalism
Donate using Payfast
![]()
Don't miss out on the latest news
We respect your privacy, and promise we won't spam you.
Next: Home Affairs accused of violating children’s rights
Previous: Commuters relieved as trains return to one of Cape Town’s busiest stations
Letters
Dear Editor
I am tired of talking to the City of Cape Town about most things: sewerage, water, garbage, recycling... take your pick.
I work in and around stormwater drains in the Deep South Peninsula most days. I see and smell the "stormwater" all the time. The number of EPA and environmental employees in the City is enough to bankrupt all the ratepayers, especially at the City's salaries, but still nothing gets done.
I am well aware that Eskom "loadshedding" causes havoc with pump stations but there are other ways to deal with the problems, instead of blaming the ANC for Eskom. Firstly, generate your own electricity, forget about Eskom being fixed, ever. Steenbras pump storage was built in the 1970s, what has the City done since then? One wind farm in Darling?
© 2023 GroundUp. This article is licensed under a Creative Commons Attribution-NoDerivatives 4.0 International License.
You may republish this article, so long as you credit the authors and GroundUp, and do not change the text. Please include a link back to the original article.
We put an invisible pixel in the article so that we can count traffic to republishers. All analytics tools are solely on our servers. We do not give our logs to any third party. Logs are deleted after two weeks. We do not use any IP address identifying information except to count regional traffic. We are solely interested in counting hits, not tracking users. If you republish, please do not delete the invisible pixel.