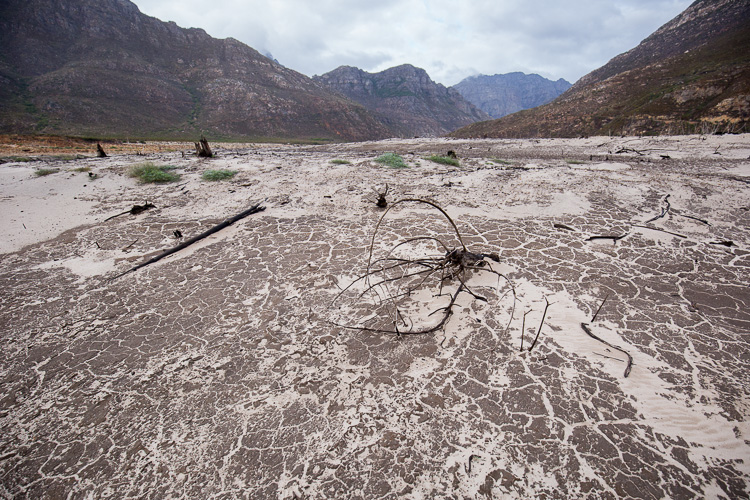
Berg River above the dam in May 2017. Photo: Ashraf Hendricks
16 May 2017
There are several likely causes of Cape Town’s water shortage. GroundUp spoke to Kevin Winter, a lecturer in Environmental and Geographical Sciences at the University of Cape Town, who helped us get to the root of the problem (we take sole responsibility for any errors).
This is part two of a GroundUp special series on Cape Town’s water crisis.
Since 1995 the city’s population has grown 79%, from about 2.4 million to an expected 4.3 million in 2018. Over the same period dam storage has increased by only 15%.
The Berg River Dam, which began storing water in 2007, has been Cape Town’s only significant addition to water storage infrastructure since 1995. It’s 130,000 megalitre capacity is over 14% of the 898,000 megalitres that can be held in Cape Town’s large dams. Had it not been for good water consumption management by the City, the current crisis could have hit much earlier.

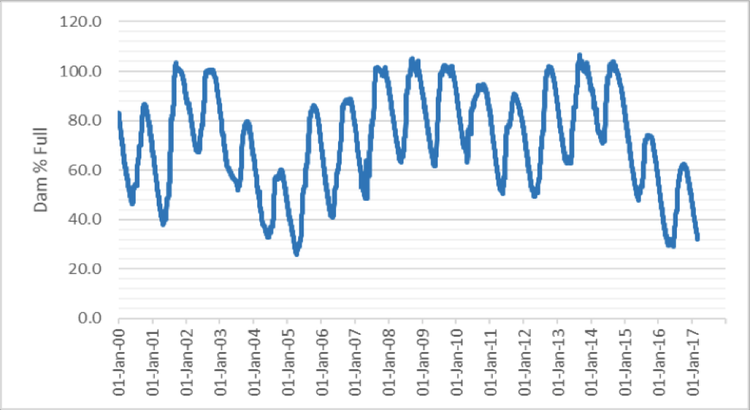
Cape Town is in the middle of a drought. The graph below shows the decreased rainfall in the past two years for Theewaterskloof, the dam supplying more than half our water.

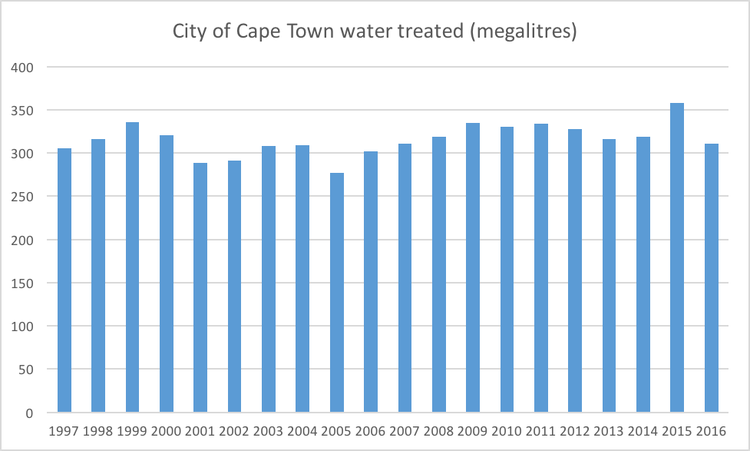
The City would not provide us with historical consumption data. However, officials did provide us with the amount of water treated. Note than in 2015 there was a spike in the amount of water treated. This suggests that consumption went up in that year, coupled with the onset of below average rainfall. However, Winter has cautioned that we can’t draw too much from this graph, because the correlation between water treated and consumed is not clear.
Winter explained that rainfall to the city’s catchment areas is coming later, dropping more erratically, and often missing the catchments altogether. “We have to acknowledge that carbon dioxide is finding its way into the atmosphere and has reached a new high,” he said. “This is a global system, so the bigger systems are beginning to impact us … there is no doubt that pressure and temperature are related. So disturb the temperature, you disturb the pressure and you start to see different systems operating.”
“Weather variability is suggesting two things to us. One is that the drought interval [the period between less than average rainfall years] is closing and that’s massively problematic if you can’t get a couple of good years to bring yourself back up,” Winter said. “[The other is that rainfall is] coming later. … We don’t get a sweep of cold fronts that are here for two or three days and drop the annual rainfall in nice, neat little batches. That’s no longer true.”
What this means is that we shouldn’t see the current water crisis as a temporary phenomenon that will resolve in a year or two. It’s a long-term problem. We will need substantial government intervention to make Cape Town’s water supply sustainable.
CORRECTION: The article originally incorrectly calculated population growth in the second paragraph. Thank you to reader Kane Croudace for pointing this out.