A school in the Eastern Cape. Photo supplied by Equal Education.
8 January 2016
The matric pass rate for 2015 is 71%. We congratulate the 455,825 youths who earned their national senior certificate this year. But we must ask ourselves, what does this statistic really reveal about South African education?
To understand the pass rate, we must take into account the hundreds of thousands of learners who never make it to matric, we must consider who the learners are that our education system is failing, and we must examine how well a matric certificate is preparing our youth for their future.
By evaluating the matric pass rate in this light we see that less than half of South Africa’s youth ever receive their national senior certificate; that those who fall behind tend to be poor, rural, and black; and that many who do pass matric are not receiving that maths and science training they need to successfully enter the labour market.
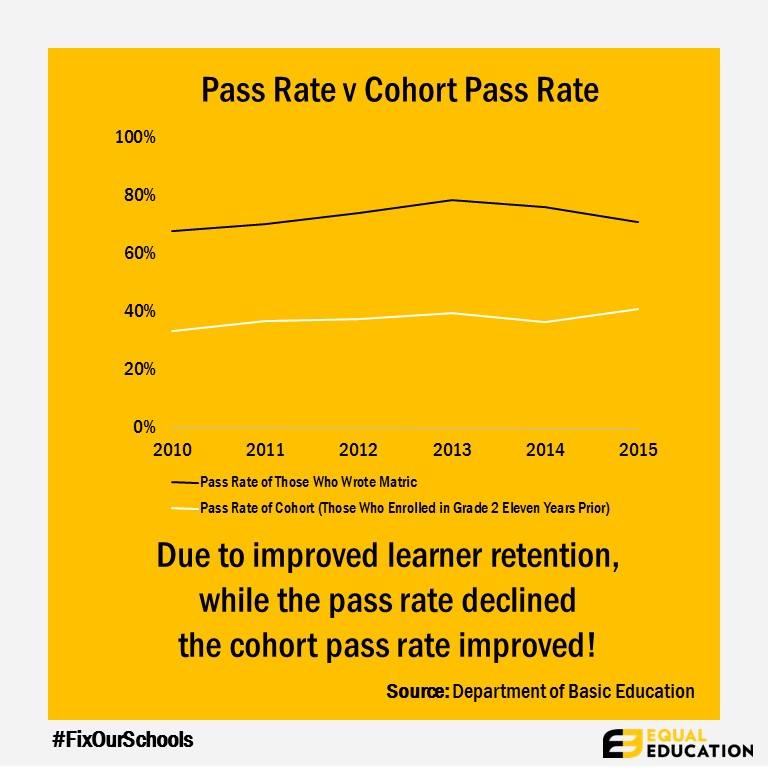
The most common way to understand the matric result is to compare it to previous years and assess whether it is improving or worsening. This year’s pass rate is 5% below the 2014 pass rate and 7.5% below the 2013 pass rate. Not only does this imply that things are getting worse, it seems to indicate that things are consistently getting worse. However, this assessment would be wrong.
First, it does not allow for regular variation in matric performance. Too many random factors can affect small changes in results and this year’s pass rate is within 3 points of the five-year average.
Second, and more importantly, it does not account for changes in the retention rate.
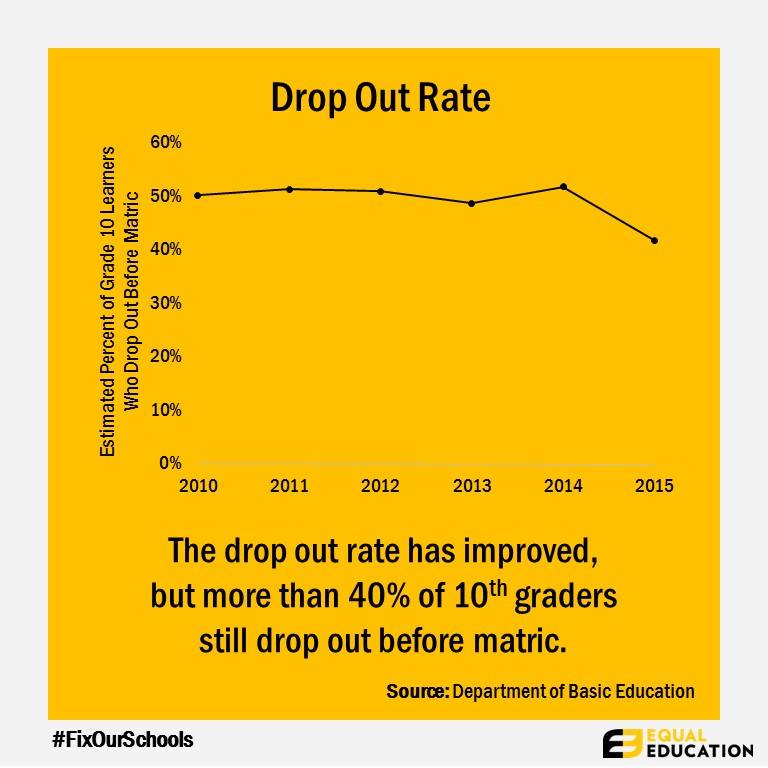
In 2015, 25% more full-time learners took the matric exam than in 2014. This cannot be explained by a population increase. The matric class of 2015 would have been in second grade in 2005. There were 1,118,690 second graders enrolled in that year. For the 2014 matric class, the relevant second grade enrollment was nearly identical at 1,109,201 learners. Therefore, the increase in exam takers can be better understood as a reflection of a decrease in the drop-out rate, from 52% in 2014 to 40% in 2015.
This is a major improvement and the department deserves some congratulations for it. However, what this also shows is that even if everyone passed matric, our education system would still be failing at least 2 out of every 5 children!
But everyone did not pass matric. Therefore, of the 1,118,690 second graders enrolled in 2005, the 2015 matric “cohort”, only 41% passed matric. This figure is commonly known as the cohort pass rate and this year’s cohort pass rate actually shows a small improvement over last year’s. Nevertheless, more than 660,000 mostly black youths have not received the education which they have a right to and which they need to be successful members of our economy and our society. Most of them never will.
The Department has not properly assessed why so many learners are dropping out or what happens to them once they do. A wide variety of factors likely affect enrolment. Learners are demotivated by a lack of teachers, badly resourced schools, inadequate infrastructure, having to walk long distances to school, and poor job prospects even if they pass matric – those with only a matric certificate have an unemployment rate of 34%, barely better than the 42% unemployment of those without matric.
It should therefore be our priority to understand and better address the issues that are causing so many of our youth to be left behind. Furthermore, we do know that some of these dropouts are intentional. There have been a number of reports of schools discouraging or withholding poor-performing learners from writing matric, as a strategy to boost matric pass rates and avoid being classified as an under-performing school.
The 2015 matric results also reveal a distinct provincial inequality in matric performance. More urbanized provinces, like Gauteng and the Western Cape, performed significantly better (about 85% passing) than rural provinces such as the Eastern Cape (57%), KwaZulu Natal (61%) and Limpopo (66%). Moreover, while the share of learners receiving a bachelor’s degree level pass increased from 28% last year to 36% this year, much of this improvement was concentrated in the urban provinces and performance in rural provinces actually declined between 7 and 9%.
The regional bias is unsurprising. Rural provinces such as the Eastern Cape, KwaZulu-Natal, and Limpopo have the most under-resourced and poorest schools, many of which lack water, electricity, or sanitation. Furthermore, these schools have fewer teachers per learner than their urban counterparts. Nonetheless, regional or rural/urban bias may simply be a proxy for economic inequality in the education system. Nearly all (82%) of the best performing schools in the country, those with greater than an 80% pass rate, were quintile 5 schools (i.e. rich schools). On the other hand, the majority of schools with pass rates below 30% are quintile 1 or 2 (i.e. poor schools). This in turn reflects racial inequality. An analysis of the 2014 matric figures found that 67% of white South African learners qualified to study at university while only 24% of black learners did.
The fact that our education system is perpetuating social and economic inequality is extremely problematic for South Africa’s future. Education is supposed to offer a way out of poverty for future generations, transforming existing patterns of inequality in South Africa. Instead, our school system intellectually dispossesses the black students who attend poor schools – exacerbating our legacy of educational injustice and inequality.
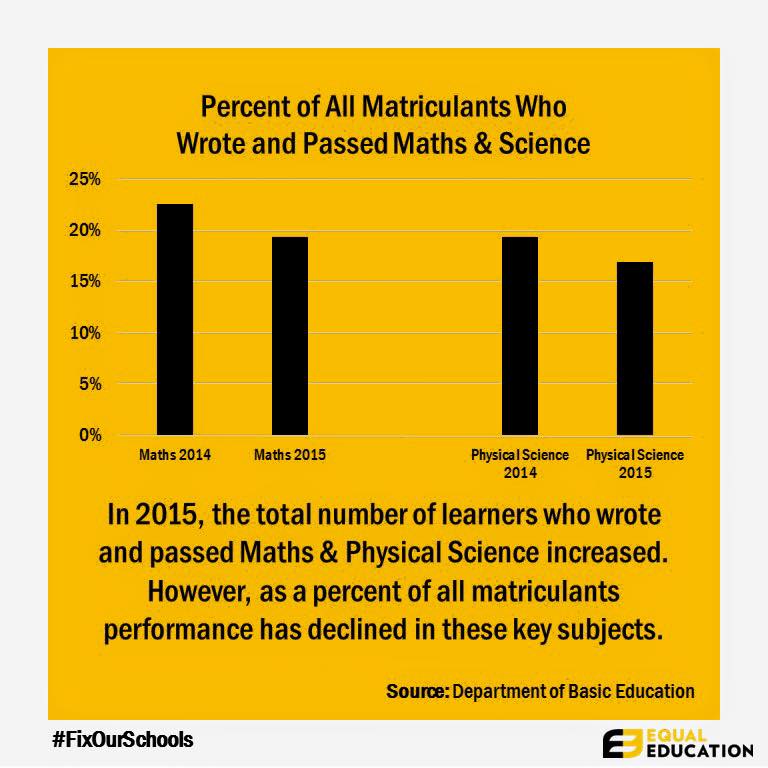
Finally, not all passes are equal. There has been stagnation in maths and science performance. In our modern world, these skills are particularly important to having the opportunity for a prosperous life. The percent of learners who wrote Maths declined by 2% (42% to 40%) and the percent of those who wrote Maths who passed at the 30% level declined from 54% to 49%. Similarly, the percent who wrote Physical Science declined (31% to 29%) as did the pass rate (61% to 59%). While this may be attributable to increased overall retention, at best it indicates that we are failing to improve in these key subjects.
Also worrying is that 3 out of 5 learners take Maths Literacy rather than Maths. The prevalence of Maths Literacy gives us a false conception of how well our education system is doing. It does not provide the same depth of conceptual and problem solving training that Mathematics does. Even more troubling, it allows schools to avoid teaching Mathematics – 1 in 4 schools do not offer Maths as a subject between grades 10 and 12.
As a result, the majority of black youth studying in township and rural schools cannot pursue careers in many needed fields of study such as engineering, accounting, actuarial and medical science. These careers are in effect reserved for learners of wealthier schools where Mathematics is offered and encouraged.
Our education system is still doing very little to undo the economic and racial inequalities of the past. Hundreds of thousands of South Africa’s learners are being left behind every year. These youths tend to be rural, poor, and black. Furthermore, of those we are educating, many are not receiving a high enough qualification or the mathematics and science training they need to support themselves and their families. This results in generation after generation experiencing the poverty of their parents.


Views expressed are not necessarily GroundUp’s.