
1 February 2021
Analysis shows that the SARS-CoV-2 virus is responsible for the vasty majority of excess deaths in South Africa since April. Illustration: Lisa Nelson
The South African Medical Research Council (MRC) has been publishing excess deaths weekly during the Covid-19 pandemic. We and others have been stating that the excess deaths are mostly due to Covid-19, and not the lockdown restrictions. This has been disputed by some people. We therefore asked Alex van den Heever of the Wits School of Governance to analyse the data. This article is longer and more technical than those we usually publish but it convincingly shows that excess deaths are almost entirely due to SARS-CoV-2 infections.
The regular publication by the South African Medical Research Council (MRC) of excess deaths in 2020 and 2021 tends to pass with only nominal commentary as to their implications for understanding the impact of Covid-19 on South Africa. The purpose of this article is to analyse the excess death information to better understand its relationship to the Covid-19 pandemic.
The method used by the MRC to estimate excess deaths broadly involves three steps.
First, the data for natural deaths for people over the age of one are sourced from death registrations. As cause of death is not yet available only the aggregate data is used. Weekly data is used for the years 2020 and 2021.
Second, historical mortality patterns for the years 2018 and 2019 for natural deaths over the age of one are used to establish baseline projections or counterfactuals for the years 2020 and 2021.
Third, deviations from the baseline or counterfactual in the years 2020 and 2021 are treated as excess mortality that cannot be explained by historical disease patterns.
By simple deduction deviations from the baseline must be due to some change in the burden of disease in 2020 and 2021 that was not present in earlier years.
As it is common cause that the Covid-19 pandemic is the single most significant change to the burden of disease in 2020 and 2021 it is likely that the excess deaths are either directly or indirectly attributable to Covid-19.
Data on deaths directly attributable to Covid-19 are published daily by the National Institute for Communicable Diseases (NICD). This data is not sourced from death certificates (the source for the MRC data), but instead derives from an ad hoc reporting system established by public and private healthcare facilities to offer immediate surveillance of Covid-19 mortality patterns.
Data accuracy for this system is however a concern for at least four reasons:
First, not all hospitals and provinces provide the same level of accuracy.
Second, the verifiability of the data is not possible for such an ad hoc process.
Third, there is no apparent tracking of out-of-hospital Covid-19 deaths.
Fourth, people who die of Covid-19 without a positive PCR test may not be included in the count.
It is therefore probable that the official reports do not reflect actual Covid-19 mortality.
There are two basic theories for any unexplained deviation (excess deaths) from the baseline in 2020 and 2021.
First, the deaths could be directly caused by SARS-COV-2 infections and the resulting disease Covid-19.
Second, they could be related indirectly to Covid-19. This could be due to reduced health service access due to lockdowns and delayed treatment due either to fear of infection or deliberate demand reductions to provide space for Covid-19 patients. These are collectively referred to as collateral deaths.
This article therefore draws on the excess death data published by the MRC and the NICD to answer two questions flowing from the above.
First, to what extent are the excess deaths directly attributable to Covid-19 disease?
Second, to the extent that excess deaths reflect mortality resulting from infection by SARS-CoV-2, what might this imply about the accuracy of South Africa’s reported Covid-19 infections?
To answer the first question, a weekly time-series of excess deaths beginning with the week of 5 April 2020 and ending with the week of 17 January 2021 is tested for correlation with both the officially reported new infection and mortality data provided by the NICD. This approach uses imperfect data from three sources to establish a more accurate understanding of the probable time series on deaths and infections.
The assumption is that although both NICD datasets may be inaccurate in their quantum, their trends offer strong measures of the Covid-19 trajectory. The guiding idea is that if either of the NICD datasets correlate well with the excess death information this would be a strong indication that the excess deaths are directly rather than indirectly attributable to Covid-19.
The analysis is performed at both a provincial and national level. High correlations at both levels, given different provincial epidemic trajectories, would offer an important indication that excess deaths are directly attributable to Covid-19 infections. The absence of any correlation would suggest that excess deaths are not directly attributable to Covid-19.
The degree of correlation is reflected by a coefficient where a perfect positive relationship would be indicated by 1.0 and a perfectly negative relationship by 0.0. The coefficient reflects the proportion of variation in a dependent variable that can be attributed to an independent variable. In this exercise the excess death estimates are the dependent variable and the NICD data (for new infections and deaths) are used separately as the independent variable.
Two excess death estimates are examined. The first is the MRC estimate based on the method described earlier and made available in their spreadsheet accompanying their report.
The second (designated “OWN” in the results) is prepared for this analysis and differs from the MRC only by using a simpler baseline assumption.
Here the average of natural deaths for the first 18 weeks of 2020 is extrapolated onto the remaining weeks of 2020 and the first three weeks of 2021 as a projection of expected natural deaths. The 2021 baseline is increased slightly by 1.3% (the current population growth rate) to account for population change.
The simpler approach removes movements in the baseline attributable to historical burden of disease patterns that may not be applicable in 2020 and 2021 due to the severity of the Covid-19 impact.
The excess deaths are lagged one week when correlated against new infections. This seeks to accommodate an expected time delay from infection to death. When reported Covid-19 deaths are correlated against reported excess deaths no lag is applied.
To address the second question, those excess deaths that are estimated as directly attributable to Covid-19 are used to derive a corrected series of new infections.
This requires that a plausible infection fatality rate (IFR) be applied to the revised Covid-19 mortality numbers to derive the infection levels responsible for the revised mortality. The known variable, Covid-19 deaths, is therefore used to estimate the unknown variable, new Covid-19 cases, using the IFR.
There is considerable uncertainty regarding estimates of the aggregate IFR to be applied with a wide range generated from different methodologies. Taking account of this literature, a plausible but not scientifically confirmed crude range of cumulative IFRs of 1.6% to 2.0% are assumed. Implausible rates are also compared for indicative purposes. On the low side is 0.2% with 10.2% on the high side.
The excess deaths for both the OWN and MRC series significantly exceed the reported Covid-19 deaths at 148,556, 125,444 and 36,369 respectively (Table 1) by the week ending 17 January 2021. (Total reported mortality to 30 January 2021 stands at 43,633.)
The OWN series exceeds the accumulated total of the MRC series by 23,112, a not insignificant 15.6% difference. This indicates that the baseline assumptions are material to an estimate of excess of deaths. Most of this difference (82.2%) occurs in the first surge occurring between 5 May and 5 October 2020 (Figure 1), the South African winter season. Thereafter the differences are very small.
The MRC baseline includes an increase in natural deaths during the winter to capture seasonal flu. The closer results between the two series in the November 2020 to January 2021 period is probably attributable to the absence of seasonal flu deaths from the MRC baseline which brings the two baselines closer during that period.
As it is arguable, however, that seasonal flu was interrupted by the Covid-19 pandemic, this may result in the MRC series understating excess deaths due to Covid-19 during the winter period, even if it accurately estimates excess deaths from a historical perspective.
The closure of schools may have curtailed the standard winter flu epidemic, where schools are important vectors for flu transmission, but less important for the transmission of the more infectious and contagious SARS-COV-2 virus.
It is quite plausible that Covid-19 deaths replaced a significant number of seasonal flu deaths that would otherwise have occurred.
|
Province |
Reported deaths |
OWN |
Diff (%) |
SAMRC |
Diff (%) |
|
Eastern Cape |
9 318 |
32 173 |
-71.0% |
30 413 |
-69.4% |
|
Free State |
2 567 |
7 647 |
-66.4% |
5 488 |
-53.2% |
|
Gauteng |
6 992 |
27 194 |
-74.3% |
20 708 |
-66.2% |
|
KwaZulu-Natal |
6 429 |
34 785 |
-81.5% |
30 632 |
-79.0% |
|
Limpopo |
774 |
11 774 |
-93.4% |
10 363 |
-92.5% |
|
Mpumalanga |
777 |
9 086 |
-91.5% |
7 545 |
-89.7% |
|
Northern Cape |
531 |
2 886 |
-81.6% |
2 313 |
-77.0% |
|
North West |
768 |
6 431 |
-88.1% |
3 944 |
-80.5% |
|
Western Cape |
8 213 |
16 580 |
-50.5% |
14 037 |
-41.5% |
|
South Africa |
36 369 |
148 556 |
-75.5% |
125 444 |
-71.0% |
Table 1: Reported Covid-19 deaths compared to excess death estimates from the week of 5 April 2020 and ending with the week of 17 January 2021.
Whereas the excess deaths peak in July 2020, the reported deaths peak in August 2020. In January 2021 both excess death series show a sharp downward trend in deaths that is not reflected in the reported series. At a national level the excess death trends therefore differ from reported Covid-19 both in magnitude and in the timing of their peaks in the first surge. They also appear to anticipate downward trajectories in the epidemic more accurately.
However, both the excess and reported deaths follow the general trajectory of the local epidemic, even though the latter does so with apparent reduced accuracy.
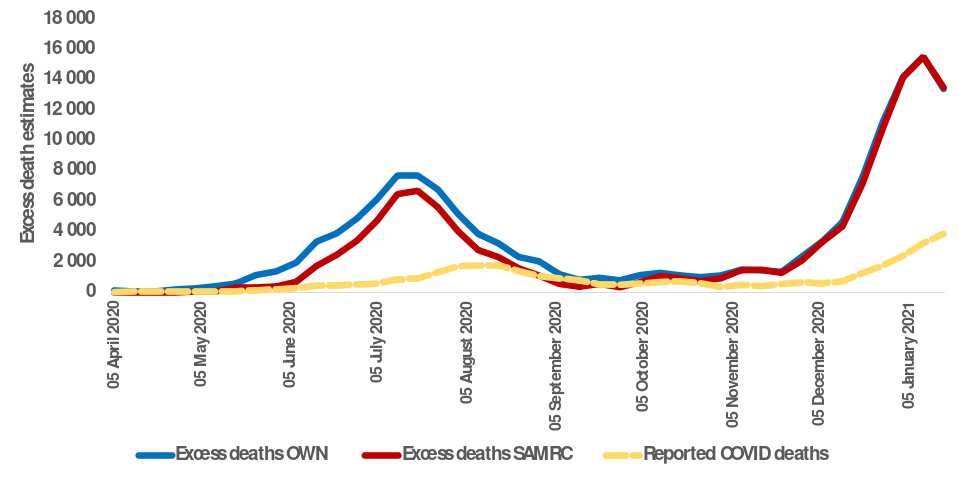
Figure 1: Reported Covid19 deaths compared to excess death estimates from the week of 5 April 2020 and ending with the week of 17 January 2021
|
Province |
Excess deaths (with 1-week lag) and new infections |
Excess deaths and reported deaths |
Reported deaths and new infections |
||
|
OWN |
SAMRC |
OWN |
SAMRC |
||
|
Eastern Cape |
0.86 |
0.83 |
0.72 |
0.75 |
0.55 |
|
Free State |
0.92 |
0.93 |
0.15 |
0.22 |
0.49 |
|
Gauteng |
0.98 |
0.98 |
0.53 |
0.52 |
0.73 |
|
KwaZulu-Natal |
0.97 |
0.96 |
0.77 |
0.77 |
0.86 |
|
Limpopo |
0.97 |
0.95 |
0.56 |
0.57 |
0.62 |
|
Mpumalanga |
0.89 |
0.85 |
0.25 |
0.24 |
0.52 |
|
Northern Cape |
0.74 |
0.79 |
0.53 |
0.55 |
0.80 |
|
North West |
0.94 |
0.86 |
0.42 |
0.47 |
0.47 |
|
Western Cape |
0.97 |
0.97 |
0.85 |
0.85 |
0.93 |
|
South Africa |
0.98 |
0.96 |
0.84 |
0.84 |
0.89 |
Table 2: Correlation coefficients testing the linear relationship between excess death measures lagged by one week and reported Covid-19 infections and deaths from the week of 5 April 2020 and ending with the week of 17 January 2021.
Excess deaths and infections for both the OWN and MRC series (Table 2) are highly correlated at both the provincial and national levels. The OWN series is more highly correlated than the MRC series at 0.98 and 0.96 respectively (noting that a result of 1.00 would indicate perfect correlation and 0.00 no correlation).
At a provincial level weaker correlations for both OWN and MRC occur in only two provinces, Eastern Cape (OWN = 0.86 and MRC = 0.83) and Northern Cape (OWN = 0.74 and MRC = 0.79). In the former instance this may be due to poor reporting of new infections as noted above, while the latter is due to the much smaller population which introduces more error into the estimates.
For the provinces outside of the Eastern Cape and Northern Cape the OWN correlations are at 0.98 for one province (Gauteng), 0.97 for three provinces (KwaZulu-Natal, Limpopo, and Western Cape), 0.94 for one (North West) and 0.92 for one (Free State). The MRC series shows broadly similar results ranging between 0.83 and 0.98.
Consistent with the trends reflected in Figure 1, excess deaths demonstrate a relatively high correlation with reported deaths, but the correlation is a lot weaker than that for reported infections. At a national level the correlation coefficient for both the OWN and MRC are 0.84.
At a provincial level the correlations show a fair degree of variability against both the OWN and MRC time series. There is however some consistency of variability between the two estimates, i.e. where the correlation coefficient is high for OWN it is also high for MRC and vice versa.
Reported deaths also reflect a relatively low correlation with reported new infections when compared to excess deaths, although it is high at a national level with a correlation coefficient of 0.89. Provinces that show high correlations with new infections and reported deaths, such as the Western Cape and KwaZulu-Natal, also show high correlations for excess deaths and new infections as well as excess deaths and reported deaths.
The Northern Cape appears anomalous in this respect (i.e. a high correlation of 0.80 for reported deaths and new infections, but low correlations for the rest). As already noted this is potentially attributable to the small population size of the province.
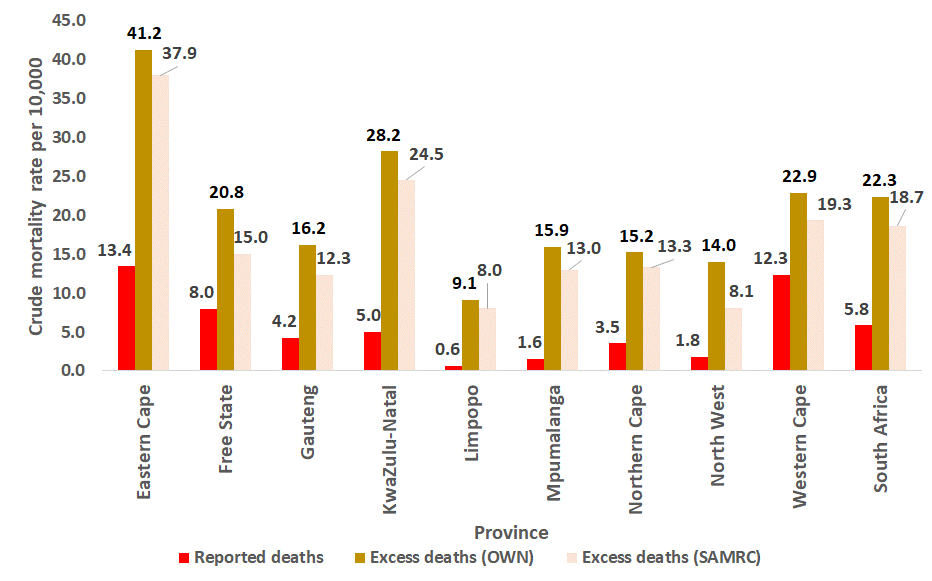
Figure 2: Crude Covid-19 mortality rate estimates per 10,000 population using the 2020 mid-year population estimates produced by Statistics South Africa for the week of 5 April 2020 to 17 January 2021.
The crude Covid-19 mortality rate estimates based on the different estimates of Covid-19 mortality suggest that the Eastern Cape has fared worst with around 37.9 to 42.2 deaths per 10,000 population based on excess deaths.
The difference between the mortality rate from excess deaths and for reported Covid-19 deaths is stark at a national level with estimated Covid deaths at around 18.7 to 22.3 deaths per 10,000 population while reported deaths reflect a rate of only 5.8.
On these estimated Covid-19 deaths, a general pattern emerges where the more urban provinces (especially those containing large highly populous cities) have higher mortality rates per 10,000 population than more rural provinces. However, Gauteng (12.3 to 16.2) still exhibits a lower rate than the Western Cape (19.3 to 22.9), Kwazulu-Natal (24.5 to 28.2) and Free State (15.0 to 20.8).
These differences may however change as further information becomes available on the second surge which has impacted significantly on Gauteng and KwaZulu-Natal and where all the expected mortality is not yet recorded.
The very high correlation between new infections and estimates of excess deaths strongly suggests that these deaths are directly attributable to disease-related mortality arising from infection with the SARS-COV-2 virus.
While the reported new infection data may not accurately reflect the quantum of new infections, it is very probably a strong indicator of the disease trajectory at both the provincial and national level on the reasonable assumption that the testing strategies are relatively stable over time.
By way of contrast the reported Covid-19 mortality information is collated using a more ad hoc process, with reporting via healthcare facilities to the NICD. The weak relationship between reported deaths and reported new infections reinforces the conclusion that reported deaths have errors in both the trajectory of deaths as well as the quantum – with significant variations by province.
As the excess deaths are based on a relatively robust system of reported deaths, significant errors in the quantum of deaths are much less likely.
The correlations with reported infections (reliable as a trend) confirm that the excess deaths (reliable as to the quantum) are directly attributable to Covid-19 infections. It can be reasonably concluded that excess deaths reflect the true extent of mortality arising from Covid-19 infections.
It could however be argued that some excess deaths are attributable to reduced access to healthcare services due to stringent lockdowns and/or over-crowded facilities due to Covid-19 cases and/or deferred treatment to expand hospital capacity in anticipation of Covid-19 cases. So while these deaths would be attributable to Covid-19, they would be indirect or collateral in nature.
However, while some collateral deaths may have occurred, it is improbable that they would have closely followed the new infection trajectories for both the first and second surges. Three reasons can be given for this.
First, there is no correlation between the lockdown periods and the infection or mortality trends. Furthermore the second surge demonstrates a substantial rise in excess mortality during a period where only level 1 restrictions were in place. The level 3 restrictions imposed from 27 December 2020 are also far less restrictive on movement than the level 5 restrictions. The period of level 5 restrictions also coincide with lower excess mortality than subsequent less restrictive measures in the first surge.
Second, while some collateral deaths could be expected during infection surges, they would be unlikely during non-peak periods when healthcare services are relatively uncongested. The excess deaths however closely follow the reported infection trends in both peak and non-peak periods.
Third, where deferred treatment results in premature mortality, these deaths would not be expected to closely follow the new infection trajectories.
The argument that excess deaths reflect collateral deaths is therefore weak.
While the correlation between reported infections and excess deaths is not 100% statistically, the range is between 96 and 98%. Using the correlation outcomes, the excess deaths are adjusted down to reflect those excess deaths regarded as Covid-19 deaths and reflected in Table 3. Using this approach the estimated Covid-19-related deaths are 111,227 and 133,128 for the MRC and OWN series respectively.
|
Province |
Reported deaths |
OWN |
Diff (%) |
SAMRC |
Diff (%) |
|
Eastern Cape |
9 318 |
27 741 |
-67.4% |
25 540 |
-64.6% |
|
Free State |
2 567 |
6 087 |
-61.6% |
4 403 |
-46.9% |
|
Gauteng |
6 992 |
25 082 |
-74.0% |
19 103 |
-65.9% |
|
KwaZulu-Natal |
6 429 |
32 483 |
-82.4% |
28 284 |
-79.8% |
|
Limpopo |
774 |
10 548 |
-93.4% |
9 235 |
-92.4% |
|
Mpumalanga |
777 |
7 457 |
-90.1% |
6 071 |
-87.9% |
|
Northern Cape |
531 |
1 968 |
-76.8% |
1 720 |
-73.4% |
|
North West |
768 |
5 731 |
-87.4% |
3 326 |
-78.2% |
|
Western Cape |
8 213 |
16 032 |
-46.4% |
13 545 |
-36.5% |
|
South Africa |
36 369 |
133 128 |
-73.8% |
111 227 |
-68.7% |
Table 3: Reported Covid-19 deaths compared to excess death estimates assumed to be Covid-19 deaths from the week of 5 April 2020 and ending with the week of 17 January 2021.
If excess mortality is a reliable indicator of the quantum of Covid-19 mortality, it is possible to derive the infection levels that gave rise to the deaths. This requires the application of a valid infection fatality rate or IFR.
The literature has not been very definitive regarding IFRs for Covid-19, with some postulating rates equivalent to influenza and others basing their numbers exclusively on official data. Both are expected to be incorrect. The former results in very low IFRs and the latter tend to be too high.
Basing IFRs on officially reported information suffers from the further problem of significant errors in both the numerator (new infections) and the denominator (deaths).
There is however convergence on an IFR range of roughly 1.6% - 2.0%. Using the excess deaths assumed to be Covid-19 deaths, in the case of the former this would suggest infection levels for South Africa of roughly 7.5 to 9.1 million to the week of 17 January 2021 in contrast to the officially reported 1.3 million (Table 4).
IFRs of 0.2% generate a range of 60 to 73 million infections, while an extraordinary IFR of 10.2% would be required to generate the reported levels of infection. Both are implausible.
|
Plausible range |
||||
|
Total infections to date |
IFR = 0.2% |
IFR = 1.6% |
IFR = 2.0% |
IFR = 10.2% |
|
Reported |
1 270 153 |
|||
|
Excess Mortality - OWN |
72 524 585 |
9 065 573 |
7 252 458 |
1 418 410 |
|
Excess Mortality - SAMRC |
60 096 582 |
7 512 073 |
6 009 658 |
1 175 347 |
Table 4: Estimation of true Covid-19 infection levels extrapolating from excess deaths from the week of 5 April 2020 and ending with the week of 17 January 2021.
Due to considerable uncertainty concerning a population IFR for South Africa or globally, these estimates should be regarded as tentative.
This analysis strongly suggests that excess deaths are directly attributable to Covid-19 infections rather than collateral deaths. This is indicated through the high correlation between new infection trends by province and nationally with excess death trends using two methods of estimation.
As a result, South Africa’s Covid-19 mortality to the week for 17 January 2021 is most probably in the range 111,227 to 133,128 rather than 34,828. This is roughly a three- to four-fold difference from the official data.
Differences in approach to the estimation of excess deaths involve the use of alternative baseline (counterfactual) estimates, i.e. the estimated non-Covid-19 deaths. The MRC approach, which makes use of historical mortality patterns, results in a weaker correlation with reported infections and lower estimated mortality values in comparison with the OWN series, which uses a simpler baseline derived from the first 18 weeks of 2020. Most of the difference in results occurs in the winter of 2020 and appears to be due to an over-estimate of expected flu-related deaths in the MRC series.
Provinces appear to differ in the quality of their reported Covid-19 deaths. By way of contrast new infection reporting appears to reflect a consistent trajectory with uncertainty concerning the quantum. However, there appear to be problems with new infection reporting by the Eastern Cape.
Extrapolating from the revised Covid-19 mortality, the true level of Covid-19 infections may range from around 6 to 9 million depending upon the IFR used and method for estimating excess deaths. This is significantly higher than the reported 1.3 million infections to the week of 17 January 2021. And the infections may even be higher if the IFR is found to be lower than used here. The “plausible” estimates cannot be regarded as anything more than tentative due to general uncertainty regarding a reliable IFR for Covid-19. Nevertheless, given the adjusted Covid-19 death estimates using the excess death information provided by the MRC, it is likely that the reported infections for SARS-CoV-2 are far from a true reflection of actual infections.
Arising from this analysis, therefore, the Covid-19 pandemic has evidently had a more severe impact on health outcomes than suggested by official reporting. It may therefore make sense for the NICD to routinely publish information on the probable undercounts of the new infection and mortality data they publish. This could usefully include an indication of the reliability of data provided by provinces.