19 May 2020
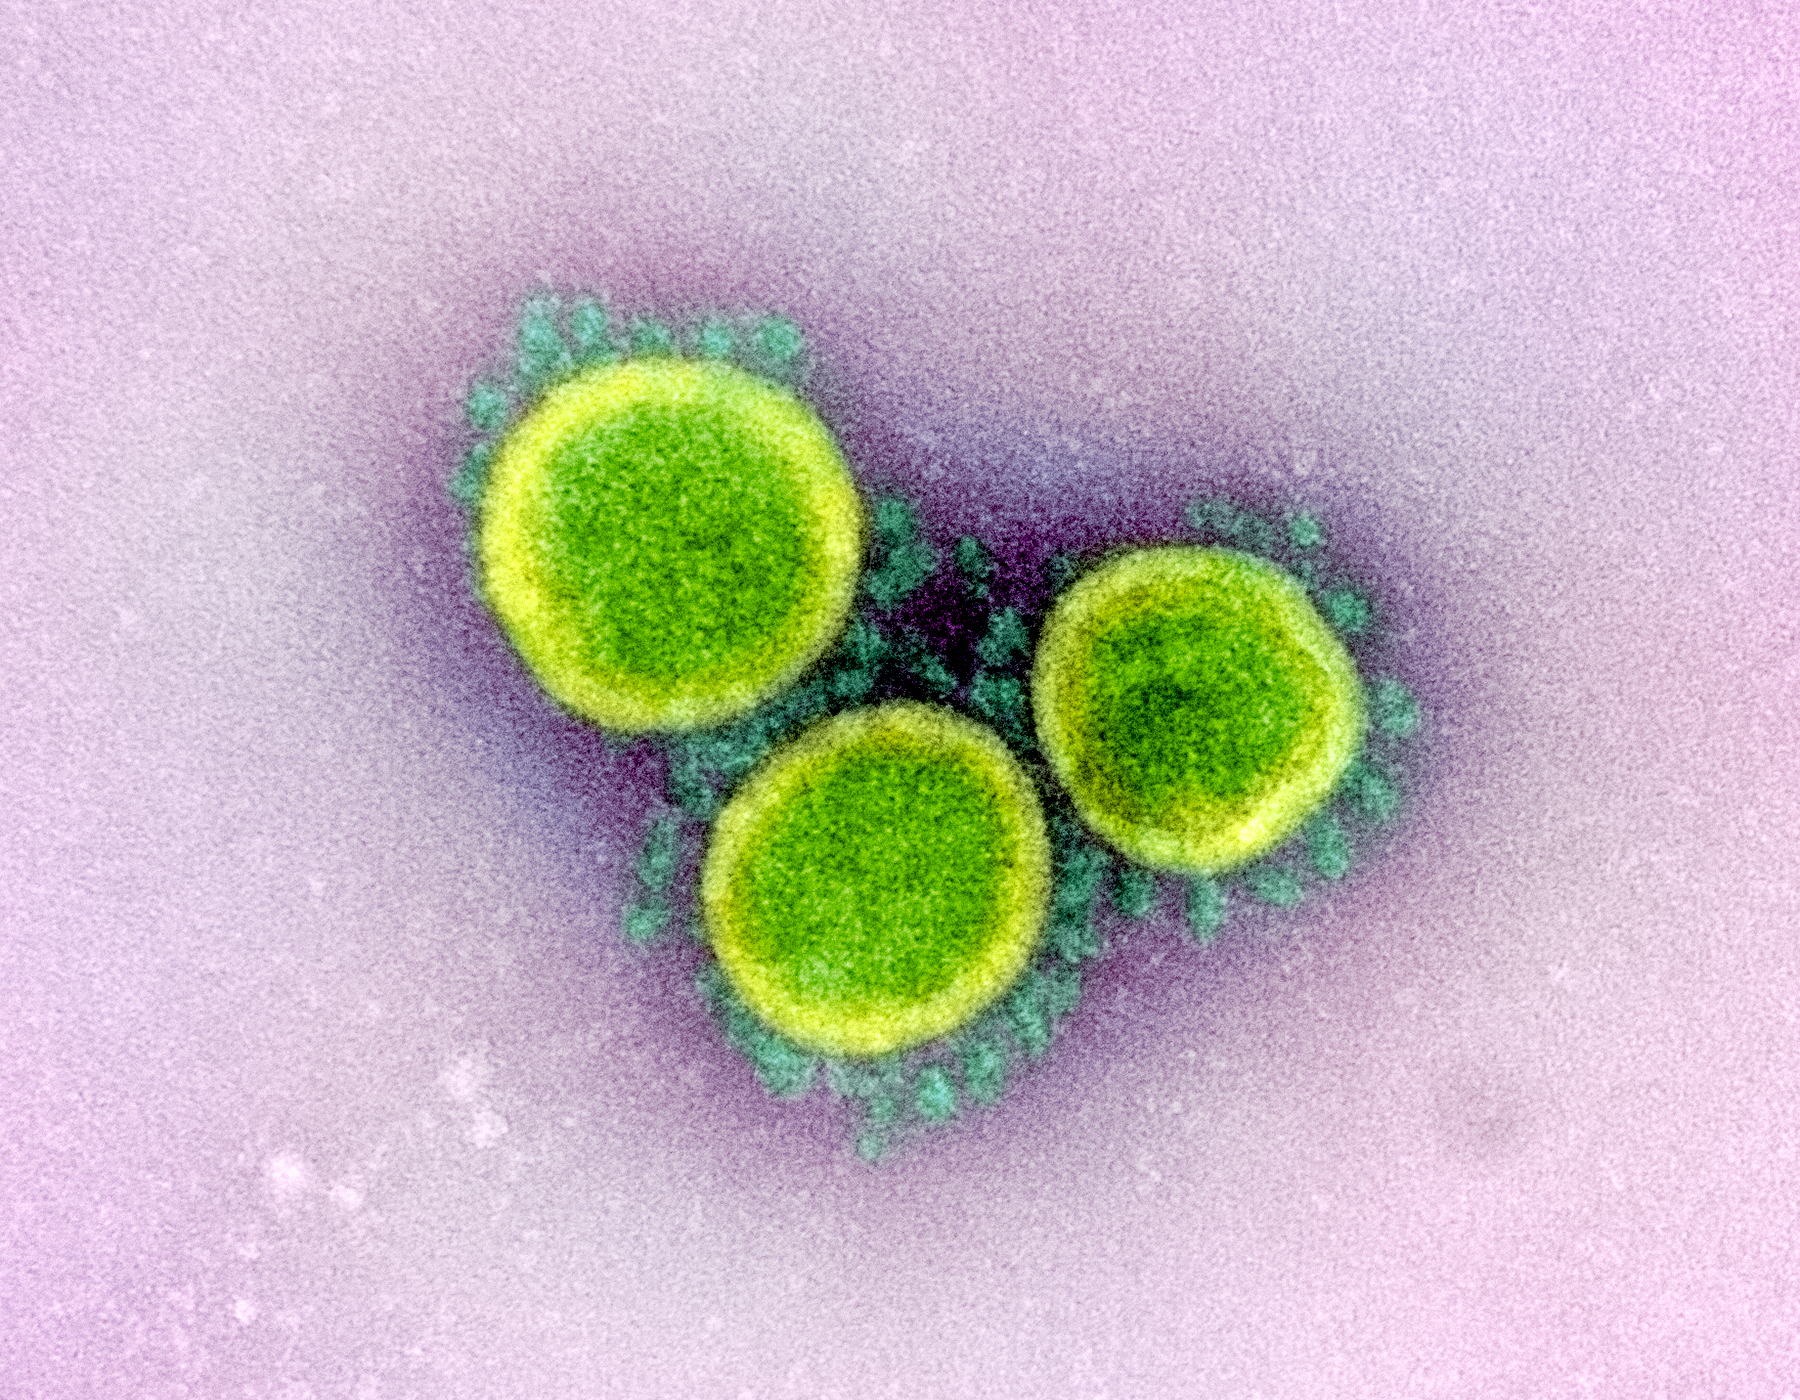
Transmission electron micrograph of SARS-CoV-2 virus particles, isolated from a patient. Image captured and colour-enhanced at the NIAID Integrated Research Facility (IRF) in Fort Detrick, Maryland. Credit: NIAID (CC BY 2.0)
R0 is on everyone’s lips these days, and it is a critical measure of the epidemic that guides predictions and policies. Yet how R works is widely misunderstood and this leads to inappropriate conclusions. I hope this article will clarify some misunderstandings. But I must emphasise the examples here are for the purpose of illustrating how R works, and are not accurate predictions of how the epidemic will actually evolve in South Africa.
R has quite a technical definition, but can be understood as the number of people the average infected person will directly infect.
R is determined largely by three factors. The first is how infectious the organism is: the likelihood of transmitting the infection in a single encounter between an infected person (the infector) and a susceptible person. A virus that lives in the nose and lungs and causes lots of coughing and sneezing might be expected to lead to far more people being infected than one that does not cause coughing and sneezing.
Second, R is determined by how many susceptible people the average infector meets in a day. And third, R will be influenced by how many days the infector remains infectious. This is usually the time from developing symptoms to recovery or to death, but in the case of Covid-19, it appears to be about 12 days on average, often starting a few days before symptoms appear. Clearly, the more people one has contact with in a day, and the more days an infector is infectious and exposed to susceptible people, the higher the value of R.
R will obviously change continuously throughout an outbreak. For example, if people start wearing masks, the likelihood of transmitting the virus during any one encounter between an infector and a susceptible person will diminish. If infected people are isolated soon after they get infected, then the number of days during which they may be infecting others, and therefore the total number of people they encounter, will be reduced, reducing R. Or if the society practices social distancing, the number of people each person meets in a day will be lower, again reducing their likelihood of meeting up with an infected person.
A critical factor that reduces R is the growing proportion of the population who become immune, having recovered from the infection (assuming no vaccine). If, say, half the population were immune and they were evenly distributed in the population, then only half the number of contacts that the infector has every day will be susceptible, so it is the equivalent of encountering half as many people leading to half as many infections.
At the start of an outbreak, when all individuals are susceptible to infection because they have no immunity to it, and before there are any systematic interventions to reduce contacts or transmission, the value of R is denoted as R0, (R nought), known as the basic reproduction number.
R0 is the number of direct infections generated by an infected person at the start of an outbreak. As soon as the infection takes hold in the community, the number of ‘susceptible’ people begins to decline, because some have recovered and become immune (we still don’t know how much immunity people who have recovered from Covid-19 have, though).
Moreover, various interventions will be implemented, which reduce how many people one individual will infect. To represent this ever-changing value of the reproductive number, we should use the term Re for “Effective Reproductive Number”: the number of individuals that an infected person will infect at some point after the outbreak has started. Unfortunately publications often use R0 when they should use Re.
When Re is greater than 1, it means that each infected person infects more than one other person – so the rate of infection increases. If Re is less than 1, it means that not every infected person infects someone else, so over time fewer and fewer people are being infected and the outbreak declines.
Misconception 1. Many people, when talking about the importance of Re coming down to a value of 1, assume that when Re equals 1, the number of cases will no longer increase and the cumulative number will soon plateau. This is wrong. The total number will continue to climb. How fast it climbs will be determined by the number of daily new cases at the time that Re reaches 1.
This continuous increase is because Re = 1 means that each current infector will infect one other person over the infectious period of 12 days, but since most transmission happens in the first few days of that period, the average time to infect someone will be about 5 days. On 10 May in SA, we had reached a cumulative total of 10,000 cases and there were 600 new cases who had just become infectious. Now, if Re had dropped to 1 on 10 May, there would have been no increase in the number of new cases each day. Thus, by 15 May, 600 new cases would have been generated by those infected on 10 May, and by 16 May, another 600 new cases would have been generated by those infected on 11 May, and so on. The result is that every day thereafter we would see another 600 new cases, and this constant daily increase would continue so long as Re remains 1.
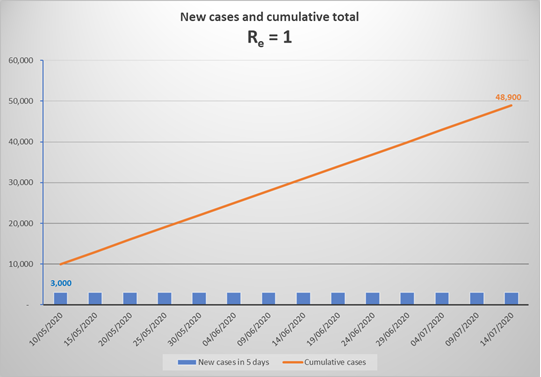
The above graph represents what would happen in SA from now to mid-July, if Re remained equal to 1. By mid-July, the number of cases would have increased to 50,000, and would carry on increasing by close to 18,000 per month to 150,000 by the end of 2020, and about 330,000 by end 2021 (in the absence of a vaccine). Due to the increasing number of immune individuals, Re would reduce ever so slightly with each generation of new cases, thus the monthly number of new infections would drop very slightly, but by end 2021 Re would still be 0.995 generating 13,000 new cases a month.
Note that if we suddenly achieved Re = 1 at a point where we were experiencing 6,000 new cases a day, then from that point on the new daily cases would continue at 6,000 per day, and the total would initially escalate at a 180,000 per month. It is quite likely, given current rates of increase, that we will experience 6,000 new cases a day by the end of June, which means cumulative cases would reach well over 1 million by the end of 2020 and 1.8 million by the end of 2021. Re would only have declined to 0.97, due to the immunity of nearly 1.8 million recovered infections (3% of the population). Over the 18 months, with eventually 3% fewer new infections in each 5 day cycle, the monthly new cases would have reduced to around 19,000 by late 2021.
In summary, when Re is 1, the epidemic continues to add new cases at the daily rate that prevails at the time when Re reaches 1, and declines very slowly as the new cases contribute to the proportion of immune individuals in the population.
Misconception 2. If Re is less than 1, many believe this signals a rapid decline in new cases. But to avoid disappointment, we need to understand that if and when we achieve an Re less than 1, the epidemic will still continue for a while to generate more cases, though the number of daily new infections will steadily decline to 0. For example, if Re dropped to 0.8 at the end of June, when daily cases are 6,000 per day, the number of cases for the rest of the year would look something like this:
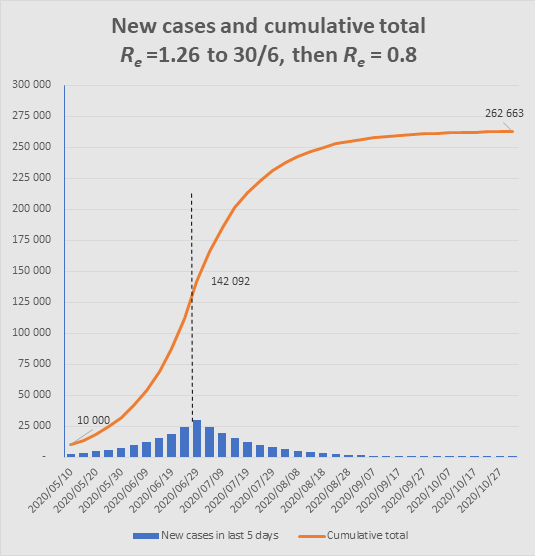
The graph shows how, after Re changes from 1.26 to 0.8 at end June, an additional 120,000 cases would still occur to end October, similar to the number of cases that had occurred up to that point. (Note that such a sudden change is unrealistic, but the point is to illustrate the momentum in the epidemic such that even with Re well below 1, the epidemic still has a long way to go.)
Misconception 3. We can avoid the epidemic reaching into the millions if we can hold Re at a lower level – say at 1.1.
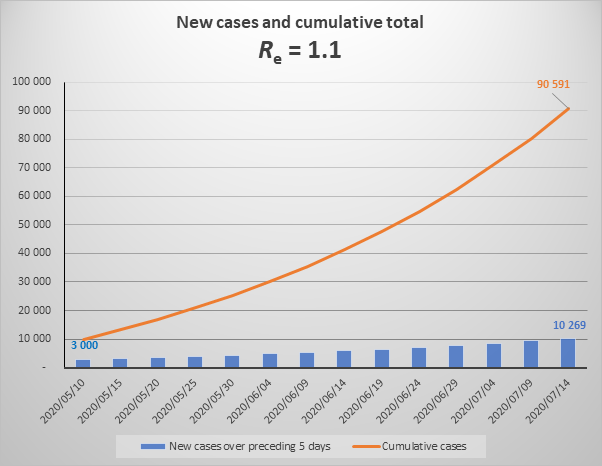
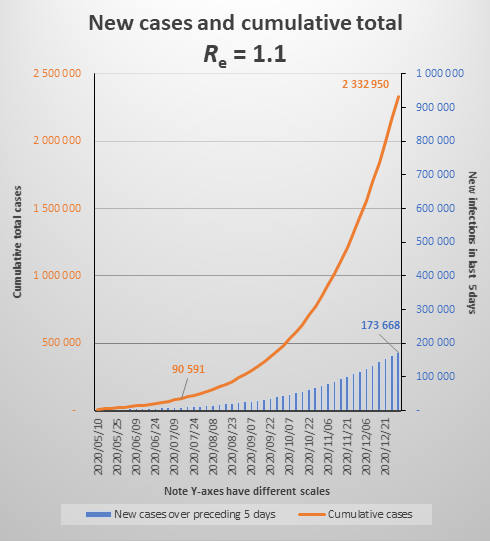
The above graph shows the increase in cases over the next 2 months if Re were to equal 1.1 (note that is substantially lower than current Re which is 1.3). It looks reasonably reassuring with a steady, apparently not exponential, increase. But this is misleading.
The graph below shows the same parameters extended to December 2020, which shows that the increase is close to exponential. (To be properly exponential, the Re would have to be constant throughout the period. Because of the growing number of immune cases, Re is declining gradually.) It also shows that by year end we would be experiencing about 35,000 new cases each day (174,000 over five days) and the cumulative total would be 2.3 million.
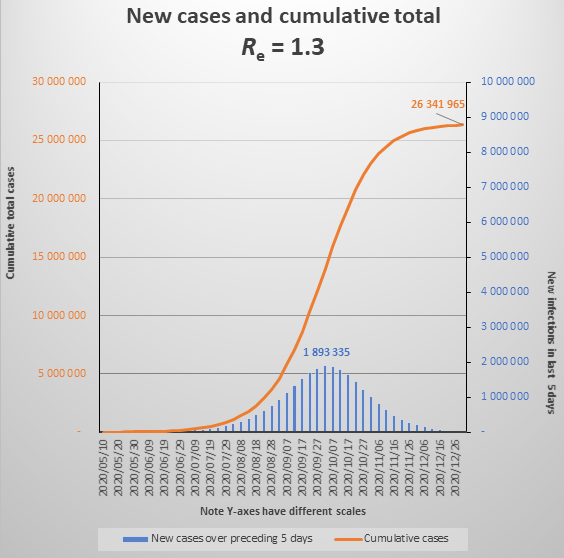
Incidentally, currently Re is at 1.3, which in effect means that 10 people who become infectious today (new cases) will cause another 13 people to become infected when 5 days have passed, and they in turn will infect 17 people five days later. If there is no change to the behavioural and policy determinants of Re (if Re only changes as a result of infected people recovering and becoming immune), the epidemic will reach what is called the Threshold Herd Immunity in early October, when new daily infections will peak at about 400,000 per day. The epidemic will be over by the end of 2020, having infected about 26 million people. See the graph below. (Note that graphs do not show daily cases but new cases over 5 days).
I emphasize again that these models are illustrative, to help understand the significance of R. But they also illustrate one plausible scenario for the epidemic. If we don’t see the dramatic numbers highlighted here, it will be for some of the following reasons:
The first, and perhaps most likely, reason is that these models assume a homogeneous population with infections spreading evenly and randomly through the whole population. In reality, the population functions as community clusters with infection expanding within the community but spreading to neighbouring communities more slowly, because contact between communities is relatively low, unlike contact within communities. This causes some communities to advance in the epidemic while others lag and only start later. The effect nationally is to slow down the epidemic but extend its duration.
Another reason we may not see the dramatic numbers is if a significant proportion of those infected never develop symptoms or develop very mild symptoms and do not come to health facilities for testing. In New York it is thought that only 10% come with symptoms and if that were true here, then of the total of 26 million we may only be aware of 2.6 million. See here on the challenge of measuring the part of the iceberg we cannot see.
Another reason may be that Re drops because our interventions improve. For example, if quarantine and isolation rates improve (perhaps through greater testing) infectors will be infecting fewer people. Of course, we hope that social distancing, and particularly universal mask wearing, will reduce the number of people each of us infects – but we will have to adhere very strictly to the mask and social distancing rules if this is to outweigh the increased number of contacts from relaxing the lockdown. There is also speculation that some people may have an innate immunity to the Covid-19 virus that we don’t understand – and that this will effectively reduce the Threshold Herd Immunity level so that the epidemic starts slowing much earlier.
Misconception 4. We now frequently hear analysts say the lockdown has not worked, and they point to the ongoing exponential increase in the number of cases as proof. The argument goes that the lockdown was intended to bring Re below 1, and anything above that, as we have seen above, is exponential and will eventually result in millions of cases (see the two graphs above) and thus implies failure.
There may be other reasons for criticising the lockdown – such as our failure to achieve adequate preparedness of the health services, or insufficient contact tracing and quarantining, or the irrationality of certain restrictions. But the fact that we still have exponential growth in the number of cases is not a valid criticism, since it was highly unlikely that stopping this completely would have been possible given our state of preparedness in March - April. What is relevant is how the lockdown bought time by reducing Re even if it remained above 1.
The next graph shows, first, the actual trajectory illustrating how the measures introduced with the state of disaster, and then the lockdown, changed Re from about 3 to about 1.3 (at least as measured by positive tests). The Re values marked on the graph are the actual Res before and after 27 March.
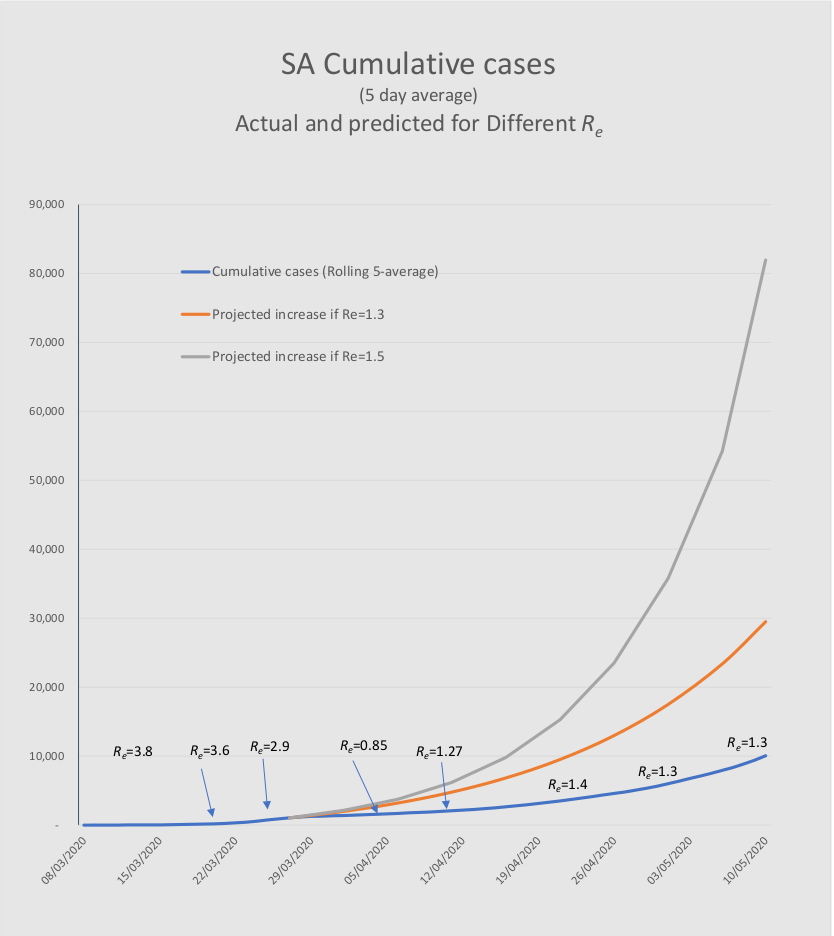
The two higher level lines, that start on 27 March, show how many cases would have been generated had Re continued at higher levels. Re values of 1.5 and 1.3 are simulated. (For various reasons it is unlikely that Re would have continued at a level of 3.) It is most likely that the dramatic reduction in Re was substantially due to the social distancing and lockdown, which averted the rapid surge to 82,000 and about 1,600 deaths by 10 May. This did indeed give the health services time to prepare for the epidemic. As we have seen in the earlier section, these cases will almost certainly still materialise – that cannot be avoided.
The infection reproduction number, R, is not a straightforward concept, and its frequent misuse leads to several misconceptions about how the epidemic behaves.. The four insights I have attempted to clarify are:
When Re reaches 1, the number of new daily cases starts to decline, but very slowly, and for all intents and purposes, the total number of cases continues to grow at a steady rate for 6 months or more. The rate of growth is initially the same as the daily number of cases at the point when Re reaches 1.
This extends in similar fashion to the case where Re is less than 1. Although there are a declining number of new daily infections, the total still increases substantially . But we need to be aware that the epidemic has momentum. If the daily number of new cases is fairly large and immunity is not yet widespread, there are likely to be nearly as many new cases before the epidemic ends as there were before Re dropped below 1.
Values of Re that are only slightly greater than 1 still indicate exponential growth of the epidemic. Lower values of Re mean it just takes longer to peak, and still reaches very high levels (in the millions) but the threshold level for herd immunity is lower, and so the total number of cases will be lower than for a high Re.
The Covid-19 pandemic is estimated to have an R0 of between 2 and 3 (though it may be higher than 3 in densely populated communities and lower than 2 in sparsely populated ones). In SA at present we are running with an Re of 1.2 to 1.3. So the lockdown and social distancing, and perhaps other factors like socio-geography, the climate, or innate immunity, are having a beneficial effect. But if we remain at current rates, the number of patients needing hospital care will exceed our capacity by hundreds of thousands. The peak number of patients is extremely sensitive to quite small variations in Re. An intervention that reduces transmission by even 20% could still reduce Re from 1.25 to 1.0 and reduce the total number of cases by many millions.